All Methods
Introduction
Annual Naturalized Streamflow of the Colorado River 2022: 10.1 Million Acre-Feet
“The provisional natural flow is an early estimate of natural flows at the Colorado River at Lees Ferry, AZ. It is provided to give water operators and stakeholders insight into the natural flows since the most recent published year. Estimates depend on Reclamation’s 24-Month Study and are published following the completion of the January, April, and August studies. Estimates are developed from either the historical unregulated inflow or the forecasted unregulated inflow into Lake Powell from the Colorado Basin River Forecast Center. Estimates from previous studies are provided to help users understand the evolution of the provisional natural flow. Provisional data are not used for modeling purposes in CRSS.
Please note that data is SUBJECT TO CHANGE over the entire record due to source data updates.”
Data source: PROVISIONAL natural flow data 1906–2022, U.S. Bureau of Reclamation, Lower Colorado Region.
Data Processing: Data was downloaded, cleaned, and imported into R studio. Script for processing provided in Data link. The Naturalized Flow Volume was plotted using ggplot. A 10-year moving average was added using the geom_ma function.
The Hardest-Working River in the West: Colorado River Streamflow
Annual Naturalized Streamflow of the Colorado River 2022: 10.1 Million Acre-Feet
“The provisional natural flow is an early estimate of natural flows at the Colorado River at Lees Ferry, AZ. It is provided to give water operators and stakeholders insight into the natural flows since the most recent published year. Estimates depend on Reclamation’s 24-Month Study and are published following the completion of the January, April, and August studies. Estimates are developed from either the historical unregulated inflow or the forecasted unregulated inflow into Lake Powell from the Colorado Basin River Forecast Center. Estimates from previous studies are provided to help users understand the evolution of the provisional natural flow. Provisional data are not used for modeling purposes in CRSS.
Please note that data is SUBJECT TO CHANGE over the entire record due to source data updates.”
Data source: PROVISIONAL natural flow data 1906–2022, U.S. Bureau of Reclamation, Lower Colorado Region.
Data Processing: Data was downloaded, cleaned, and imported into R studio. Script for processing provided in Data link. The Naturalized Flow Volume was plotted using ggplot. A 10-year moving average was added using the geom_ma function.
Population and Water Use
Average GPCD in Colorado River Basin States (2015): 179
Water use data was acquired from the U.S. Geological Survey’s Water Use Data for the Nation, using the Data Retrieval Tool in R. Data and processing scripts found here.
Number of Households and Average Household Size in CRBAAS Counties (2023)
Household size and the number of households were summarized in ArcGIS pro, using the Popular Demographics in the United States – layer available in living atlas. Summaries were calculated using a CRBAS shapefile as the clipping extend and household size and number of households were summarized across CRBAS counties here.
Expected Growth in Total Population of CRBAS Counties (2020–2030)
The expected population growth indicator used the Georeferenced U.S. County-Level Population Projections, Total and by Sex, Race and Age, based on the SSps, V1 (2020-2100).
We averaged the population growth across CRBAS counties using SSP2 for 2030.
Hauer, M., and University, C. for I. E. S. I. N.-C.-C. (2021). Georeferenced U.S. County-Level Population Projections, Total and by Sex, Race and Age, Based on the SSPs, 2020-2100. NASA Socioeconomic Data and Applications Center (SEDAC). https://doi.org/10.7927/dv72-s254
Population of the Colorado River Basin and Areas Served 2015–2020: 43.5 Million
To calculate the CRBAS population, we utilized the POPGRID web–mapping tool, uploading the CRBAS shapefile and exporting the population count for several gridded raster data sets. Gridded data sets provide estimates, not by an administrative unit, like cities or counties, but for each pixel of the map. Depending on the data source, these pixels represent squares on the earth’s surface ranging from 10 square meters to 100 square meters. Several organizations create their own gridded data sets using a different combination of population, landcover, night-time light, development, infrastructure, topography, and climate data. The POPGRID data collaborative group hosts many of these data sets and allows researchers to query all of them by defining an area of interest. For more information on how the population estimates are made, visit POPGRID.org We utilized the WorldPop 2015 population and the WorldPop unconstrained 2020 population, and calculated the 2015–2020 growth rate
Methods PDWU1 Table1. List of the gridded population data sources used in the calculation of our population indicators.
| Data Set | Source | Concept | Grid Size | Years Used |
| Gridded Population of the World (GPW), version 4 | Center for International Earth Science Information Network (CIESIN) Columbia University | Nighttime Population | 30 arc-seconds (1-km) | 2015, 2020 |
| Global Human Settlement Layer Population (GHSL) | European Commission Joint Research Center (JRC) and CIESIN | Nighttime Population | 9 arc-sconds (250m), 30 arc-seconds (1-km) | 2015
|
| LandScan Global Population database | Oak Ridge National Laboratory (ORNL) | Day time (ambient) Population | 30 arc-seconds (1-km) | 2015 |
| WorldPop | WorldPop University of South Hampton | High spatial resolution, temporally explicit data on human population and demographic distributions | 3-arc second (100 meter) | 2015, 2020
|
Note that the reported population is the population of our shapefile, or the population of the areas that contain community water systems that utilize water from the Colorado River Basin in their water supply portfolios; it should not be construed as the number of people directly using water from the Basin on a daily basis.
Development and Land Use
Change in Developed Area/Forest Cover in the CRBAS 2001–2020
The National Land Cover Database raster layer was clipped to the CRBAS using the Extract by Mask tool in ArcGIS Pro. Counts of pixels were converted to area by multiplying each pixel by 900 square meters and converting into acres and square miles. Data is summarized here. Forest Cover is the sum of Deciduous Forest, Mixed Forest, and Evergreen Forest. Developed land is the sum of Developed, High Intensity; Developed, Medium Intensity; Developed, Low Intensity; and Developed, Open Space.
Proportion of Housing Zoned Single-Family in CRBAS Counties
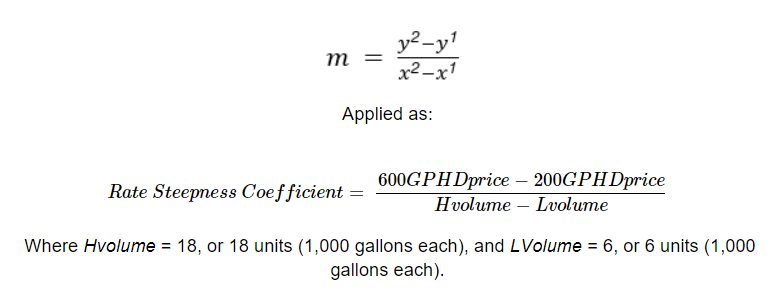
The ACS Housing Units in Structure Variables – Boundaries – Counties layer, available on Living Atlas was used as the primary data source. A percent change was calculated using the attributes: x1) Percent of housing units that are single-family residential 2010-2014, and x2) Percent of housing units that are single-family residential 2016 – 2020. Using a formula:
![]()
Median Lot Size for New Home Construction in the West
Utilized the Annual Characteristics of New Housing report part of the Census’s Survey of Construction partially funded by the Department of Housing and Urban Development. https://www.census.gov/construction/chars/. Data found here. Data from the Survey of Construction is broken down by region and nationally, which limited our ability to look at new home construction in the CRBAS specifically.
Facts from Survey:
- 970,000 single-family homes completed in 2021, median size 2,273 sq ft
- 371,000 multifamily units completed in 2021, median size 1,032 sq ft (rent), 1,261 sq ft (sale)
- 12,000 multifamily buildings completed in 2021
Water in Comprehensive Plans
Limitations
Our purpose in using this indicator is not to compare communities against each other and we understand that a comprehensive plan does not detail every policy or program within a community. There are a number of limitations associated with this indicator:
- Assumptions that can be drawn from a comprehensive plan
- Individual community use of a comprehensive plan
- Year of plan update
- Differing state statutory requirements
Assumptions that can be drawn from a comprehensive plan: Comprehensive plans are not all-encompassing policy documents, and communities do water policymaking primarily through other processes, such as Water Management Plans or individual ordinances and budget items. We therefore cannot claim to fully understand the water policies of any CRB community from its comprehensive plan alone. To this end, additional Indicators homing in on particular water policy areas are being explored.
Individual community use of a comprehensive plan: Each community uses its comprehensive plan differently—including not using or referencing it at all. Implementation of a comprehensive plan is incredibly difficult to discern, beyond matching up proposed policies with passed ordinances or budgeted programs and verifying with planning departments and elected officials the extent to which it is used and referenced. Some communities adhere to their comprehensive plans even years beyond initial writing and adoption. Some communities use just the land use map and zoning designations of the plan. Some communities do not use or reference their plans at all after passage. In a review of this scale, it is incredibly difficult to verify the use and importance of the comprehensive plan in each community reviewed.
Year of plan update: Each comprehensive plan is updated according to its own schedule. Some states require that plans be updated on a particular timeline, such as every 10 years. Even then, individual community plans will have been initiated and updated according to their own schedules—and states do not tend to have an enforcement mechanism for this requirement, beyond making communities ineligible for certain funding pools if they do not have an updated comprehensive plan on file. The range of ages of comprehensive plans reviewed includes those from 1999 (Sante Fe, NM) to 2022 (Yuma, AZ). Further, California communities in particular—but not solely—tend to update their comprehensive plans in individual increments rather than as one cohesive project. The Los Angeles plan reviewed, for example, includes a Public Facilities and Services Element that appears to be from 1969, and a Housing Element adopted in 2021 and amended in 2022. In cases such as this, the water policies within the Housing Element are stronger and more modern than the whole description of water supplies in the 1969 Public Facilities and Services Element. One can also assume that cities like Los Angeles must rely on other water planning documents, like Urban Water Management Plans, for more updated information and planning related to water resources in the community.
Differing state statutory requirements: Each state has different enabling legislation and statutory requirements for comprehensive plans. Arizona has required a water element within comprehensive plans since the early 2000s. Utah has newly passed (2022 legislative session) a requirement for water elements. The other Colorado River Basin states do not have clear mandates for the inclusion of water within comprehensive plans. Communities within those states thus are likely to pay more attention to the other topics that may be mandated by state statute—though this does not prevent them from incorporating water anyway. Pettit and Shah (2021) go into detail about the discrepancies in planning requirements across the United States.
Evaluating Water Integration in Comprehensive Plans
The method for evaluating water integration into comprehensive plans was tested and refined between the years of 2017 and 2019. An initial test framework was created based on a literature review and refined with expert input, then tested across 159 comprehensive plans. These tests revealed limits and opportunities that were applied to a new framework created through additional literature review, a crosswalk of topics within that literature review, and peer review. The framework—used in this evaluation and further explained below—has been applied to 135 plans to date.
Topics within the Comprehensive Plan Review –Comprehensive plans are evaluated for inclusion of water according to 20 categories across three topic areas:
| Overall Evaluation Score | |
| Water Mgmt. | Existing Water Supplies and Availability |
| Water Use/Demand | |
| Water Financing | |
| General Water Conservation Programs | |
| Water and Wastewater Infrastructure | |
| Water Quality | |
| Future Planning | Projected Population and Economic Change |
| Projected Development and Land Use Change | |
| Water-Related Hazard Mitigation | |
| Forecasting Water Supply/Demand | |
| Water Supply Augmentation | |
| Water Equity | |
| Water Efficient Land Use | Collaboration for Land/Water |
| “Show Me the Water” Requirements | |
| Water in Development Processes and Evaluation | |
| Water Efficient Urban Form and Zoning Regulations | |
| Landscaping/Irrigation Policies | |
| Building/Plumbing Policies | |
| Stormwater Management | |
| Water for Ecosystem Functions |
Each topic is given an individual score from 0 to 3, then aggregated into its category, which is then aggregated into its overall evaluation.
Breakdown of values that determine topic quality based on the average
| Value | Range | |||
| Describes | 0.10 | – | 1.30 | |
| Analyzes | 1.31 | – | 2.30 | |
| Integrates | 2.31 | – | 3.00 | |
Scoring System for Comprehensive Plan Review
| 0 – Absent | 1 – Describes | 2 – Analyzes | 3 – Integrates |
| Category is not discussed in the plan. | Discusses at least one topic.
Topic is mentioned in the plan at a basic level, but not further described. Plan describes at least one topic solely through a single metric. Discusses need to meet state and federal standards. Does not provide any analysis as defined by the “Analyzes” score. |
Discusses at least one topic. Topic may be:
|
Discusses at least one topic. Topic is carried through to implementation actions in specific and actionable language. Must include one of the following:
Topics may be described in a more narrative format that does not cover the above items. If so, one of the following must be present:
|
Plan language is collected in an Excel spreadsheet and sorted into the relevant topic and score.
Rules for Sorting Plan Language:
Rules should be considered in the following hierarchy but used according to what is most appropriate to the specific plan language under review.
- Plan language is assigned to the most specific topic it is applicable to. Ex: “Integrate sound water conservation and reuse systems into new and updated public facilities” should be categorized as Building/Plumbing Policies.
- Plan language is assigned to the topic that most relates to the end-use of water. Ex: “All large turf areas (e.g., schools, parks, golf courses, etc.) should use reclaimed water or other approved rain harvesting techniques for irrigation purposes” should be categorized as Landscaping/Irrigation Policies.
- When plan language includes several topics under a general auspice, the more general category is used. Ex: “The City shall promote water conservation in landscaping for public facilities and streetscapes, residential, commercial and industrial facilities, including use of water-conserving fixtures (low water usage) and low‐water‐use plants” should be categorized as General Water Conservation.
- If plan language is applicable to multiple topics, and no other language or policies are present to account for those policies, the same language may be counted for multiple topics. Ex: “The City has water block rates to create an affordable water cost to customers” can count for both Water Financing and Water Equity if no other plan language is present for these.
Water Utilities: Conservation Versus Cost
Water Price Data Collection
Data were collected by analyzing the most recent publicly available water rate document for each community water system (as of January 2022). Using the water rate document, estimates were made for the price of 6,000 gallons per month—representing low indoor water use, roughly 200 gallons per household per day (GPHD) over 30 days; moderate water use—12,000 gallons per month, or 400 GPHD; and high-water use—18,000 gallons per month, or 600 GPHD. Water rates used in these calculations were based on January 2022 pricing to account for only indoor water use. Single-family residential pricing was used for a three-quarter-inch meter. Following water price estimation, attempts were made to reach out to each community water system for price confirmation and comment. Seven of 37 utilities responded and their input was used to correct any miscalculations. All prices include base service fees and additional fees or surcharges, though stormwater, sewer costs, and taxes were excluded. To calculate the rate steepness coefficient, the slope formula was used to determine the slope between the price and volume of what we considered low monthly water use and high monthly water use.
Risk, Resilience, and Vulnerability
NRI Limitations
It is important to recognize that the meaning of the concepts of risk, vulnerability, and resilience are heavily debated in the research community. They are highly complex phenomena that are difficult if not impossible to quantify due to their qualitative nature and/or a lack of readily available data. Thus, even though the scientific community has thoroughly vetted the indicators of risk, vulnerability, and resilience we utilize in this chapter, they represent particular, not universal, definitions of these concepts. So they are necessarily reductive and somewhat partial because they exclude factors—for example, the diversity of a water provider’s water portfolio, or the relative security of a water user’s water rights.
Scale is another limitation of these indicators. While aggregating data to the level of census tracts and counties is useful and necessary for comparing different regions, it can obscure important local-level variations, such as statistical outlier communities. This is especially important in the western U.S., where many counties are very large and socially and environmentally heterogeneous. As noted by FEMA, the NRI is appropriate for broad comparisons but is not a substitute for localized risk analysis.26 It is useful as a high-level diagnostic tool and to identify where more information is needed to better understand risk in specific localities.
What is the FEMA National Risk Index?
In order to interpret the results, it is important to understand a little about what the NRI is. For a deeper dive, see the Additional Resources at the end of this chapter and data dashboard. The NRI is a holistic quantification of the potential for negative impacts resulting from natural hazards. It is comprised of three sub-indicators: Social Vulnerability Index (SoVI) (SV); Community Resilience (CR); and the estimated annual economic losses (EAL) associated with 18 different kinds of natural hazards.25 The relationships among the three component values are captured in the equation:
(EAL x SoVI) / CR = NRI
The first two terms—Estimated Annual Loss and Social Vulnerability—are “consequence enhancing” components of risk, meaning that all else equal, the higher the score, the higher the NRI for a given community and thus the greater the risk level. Community Resilience has the opposite effect: it reduces the negative consequence of hazards by mitigating the first two variables. All else equal, the greater a community’s resilience score, the lower its NRI will be and the lower the overall degree of risk.
Risk Data Collection
The data we used for the National Risk Index (NRI) were obtained online through FEMA Data Resources | National Risk Index (fema.gov). For our analysis, we clipped these nationwide data sets at both the county and census tract level to our area of interest (the CRBAS boundaries).
We did not modify the underlying methods of the National Risk Index or the component indices (Community Resilience and Social Vulnerability). Since the methods for the NRI and component indices are too complex to discuss in detail here, we point the reader to full documentation available from the sources of these data products. The best one-stop source for detailed descriptions of the data and methodologies behind the NRI and sub-indicators is FEMA’s 2021 National Risk Index – Technical Information. The Community Resilience sub-index is based on the Baseline Resilience Indicators for Communities (BRIC), which “…includes a set of 49 indicators that represent six types of resilience: social, economic, community capital, institutional capacity, housing/infrastructure, and environmental” (FEMA 2021). More information about the BRIC methods and a list papers utilizing BRIC are available at BRIC – College of Arts and Sciences | University of South Carolina. Readers interested in the Social Vulnerability Index (SoVI) project and its methodology can find more information at the University of South Carolina Hazards and Vulnerability Research Institute’s website, which includes a short methods guide, The SoVI® Recipe (Bureau, U. S. C., and Engine, C. D. (2016). The SoVI ® Recipe. September, 8–9).
County and Census tract level NRI data was clipped to the CRBAS outline and summarized.