Introduction
The need to integrate land and water management in the Colorado River Basin has never been more critical. Here, we present why—and more crucially how—to do so.
The lands and waters of the Colorado River Basin are inextricably linked. Yet land use and water management are often siloed within their respective agencies and sectors and thus administered by different departments. This leads to a patchwork of priorities, policies, and management strategies across different levels of government (federal, state, county, tribal, and local entities). The need for integrated land and water management has been widely recognized; however, effective integration is difficult to achieve and assess (Cesanek, Elmer, and Graeff 2017 Citation). Governing entities often have different missions, mandates, and objectives, but they share a need to ensure a sustainable water future. At the Babbitt Center for Land and Water Policy, we are working to advance the integration of land and water management to meet the current and future water needs of Colorado River Basin communities, economies, and the environment. Progress is being made, but much more can be done.
Here we present our first Indicators Definition of Land and Water in the Colorado River Basin interactive web report. It is intended to curate Basin-wide connections between land and water as indicators, including metrics Definition that highlight existing and potential linkages. These indicators illustrate Basin-wide trends, assessing and summarizing information that is often fragmented among states and agencies.
The public is generally aware of the ever-shrinking levels of Lakes Mead and Powell through broad media coverage, but complex interconnected issues exist, spanning multiple geographies and influencing reservoir levels. That is why we dive deeper into a sampling of Basin communities to examine what practices and policies are impacting water use throughout the region. In this report we work to connect issues at multiple scales to link Basin-wide metrics with what’s going on in local jurisdictions. The report provides a descriptive reference point for conditions in 2023, which will serve as a basis for comparison with future conditions. This report contains information intended primarily for educational and diagnostic purposes. It will also expand over time to encompass more indicators based on feedback from you, whether you are a decision-maker, scientist, land use planner, water manager, consultant, or staff in a local, state, or federal government natural resource department. We hope this report will pique your curiosity and generate additional research questions. Finally, we hope to create communication tools for discussing critical sustainability issues with policymakers, practitioners, and the public.
The bulk of this report consists of reporting on 22 different indicators grouped thematically into six chapters: 1) The Hardest-Working River in the West: Colorado River Streamflow; 2) Population and Water Use; 3) Development and Land Use; 4) Water in Comprehensive Plans; 5) Water Utilities: Conservation versus Cost; and 6) Risk, Resilience, and Vulnerability.
Indicators and Metrics
An indicator is a summary measure that provides information on the state of, or change in, the system being measured. Indicators are often confused with metrics, and the terms are often used inconsistently. Generally, though, metrics refer to a property or quantity of a characteristic in each scope or scale, and they typically require information to provide a degree of interpretation. For example, depth to groundwater, annual precipitation, or river stage are metrics. Indicators, by contrast, represent higher-order information such as ratios of multiple metrics or something like “high (or low) social vulnerability,” which combines several metrics to paint a broader picture of a system. We use the term indicator interchangeably to mean both indicators and metrics within the report, providing context when it is needed to understand metrics, and we use common indicators, as well as some custom indicators developed for this report.
Approach
Broad topics connecting land and land use with water supply and demand are defined in this report. A search was then conducted for publicly available datasets and documents spanning the geographies of the Basin and adjacent areas that utilize waters diverted from the Basin. For each thematic topic area, we chose indicators that could be compared broadly across states, counties, or communities. Our scope was narrow, only including key land and water topics in this first report, because much of the pertinent data is collected from different geographic and temporal scales, often using different units, methods, assumptions, and underlying data. For the topic areas we focused on—population, demographics, residential water use, development patterns, risk (along with vulnerability and resilience), residential water price, and comprehensive planning—the most recent reliable Basin-wide data was aggregated. Due to data accessibility and availability, we excluded several topic areas to be included in subsequent iterations of the report. Among them: agriculture (which utilizes a large portion of the Basin’s land and the largest portion of its water), past and projected warming, urban heat, wildfire, surface water supply indices, Basin-wide reservoir levels, groundwater quantity and quality, and tribal water use. We invite your collaboration and cooperation to thoughtfully examine those issues in the future.
Study Area
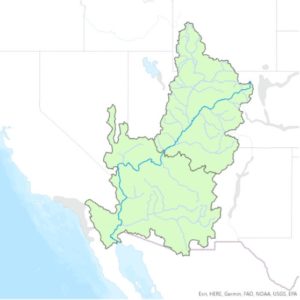
The Colorado River Basin (CRB) Definition spans over 260,000 square miles1 across seven states in the United States and two in Mexico. It’s home to roughly 14.7 million people2. However, much of the Colorado’s water is transported outside of the Basin through trans-basin diversions Definition that supply water to major metropolitan areas and agricultural regions. These areas outside the Basin that receive Colorado River water are described by the Bureau of Reclamation as the adjacent areas served by Colorado River water; hereafter, they’ll be referred to simply as the “Adjacent Areas Served (AAS) Definition.” Together, they comprise the Colorado River Basin and Adjacent Areas Served (CRBAAS) Definition, which is the study area of this report.
Geographic Scale
The geographic scale of land and water indicators required careful consideration and scrutiny. Political and administrative boundaries often determine data collection’s scale and extent. Unfortunately, those boundaries often bear little or no relation to the topographic, hydrologic, or climatic bounds that determine where water occurs naturally in the West. In his 1879 Report on the Lands of the Arid Region of the United States, John Wesley Powell suggested that western states should be organized, and boundaries drawn, based on watersheds following topographic high points rather than on lines tracing latitudes, longitudes, or the center of rivers. His vision did not come to pass; instead, we find ourselves in a situation characterized by Marc Reisner’s famous quote from Cadillac Desert:
“In the West, it is said, water flows uphill toward money. And it literally does, as it leaps three thousand feet across the Tehachapi Mountains in gigantic siphons to slake the thirst of Los Angeles, as it is shoved a thousand feet out of the Colorado River canyons to water Phoenix and Palm Springs and the irrigated lands around them” (Reisner 1993 Citation).
This mismatch between nature and administrative boundaries was linked to competition for water among private mining and agricultural interests during the early days of Anglo-American settlement of the western US. To prove their claims, successive waves of settlers raced to create flumes, irrigation ditches, and waterways to transport water far from its natural source to where it could be put to beneficial use Definition, often at significant cost. The de facto “finders keepers” and “use it or lose it” customs and rules that enabled this kind of water development became codified into the prior appropriation Definition system that still dominates western water law today (Anderson and Woosley 2005 Citation).
As a result, water users and managers may be far from the lands where those waters originate and disconnected from land management decisions that affect their water supplies. Historically, cities in the region have often approved new development with little or no regard to water supply, and then they task water managers with finding additional supplies (which are often far away) to keep up with growth only after the fact. This means that the geographies where water supply indicators may be useful can be quite different from the geographies where water demands are changing, resulting in a disconnect between land and water management (Sternleib and Laituri 2015 Citation; Stoker et al. 2022 Citation). Ideally, water management and data collection would be determined holistically, according to watershed boundaries suggested by John Wesley Powell. However, due to current laws, customs, and availability, much of the data presented in this report is aggregated according to political boundaries such as states, counties, municipalities, zip codes, or census blocks. Indicators focused on watersheds and hydrologic boundaries are being developed for future versions of this report.
We have selected 37 indicator communities to broadly represent the various climates, populations, growth rates, economies, and community types in the Colorado River Basin. We use these communities for selected indicators when the municipal scale is useful to better understand urbanization’s impact on land and water resources. The current cohort of communities has been selected because they have publicly available data, or because they have participated in past studies and trainings conducted by the Babbitt Center or its partners. We selected at least three communities from each of the seven Basin states. We recognize that some communities in Mexico and tribal jurisdictions are conspicuously absent from this sample, but we plan to expand this list in subsequent reports.
If you would like your community featured in the next report, please reach out to us at babbittcenter@lincolninst.edu.
Temporal Scale
This report has three primary timescales:
-
1) Snapshots—with data collected at irregular intervals or that has records that do not extend back in time,
-
2) Annual or multiyear change—based on discrete data sets released over one, three, five, or 10 years, and
-
3) Sub-annual time series of current conditions—data such as reservoir levels or drought, which are updated at frequent timescales and can be used to summarize seasonal, annual, or multiyear trends.
Who Would Benefit from this Report
This report was created with a broad audience in mind, from the general public to state or local planners, water resources professionals, various nonprofits, research institutions, and the advocacy groups they work with. It curates publicly available data that those interested in land and water should monitor; it also provides a “30,000-foot view” of the lands and waters of the Colorado River Basin. For the most part, we avoided creating overly technical indicators, which would have required high levels of data acquisition and participation from communities whose resources are already stretched thin. Rather, we provide broader overviews of the conditions across the Basin.