Risk, Resilience, and Vulnerability
Navigating the hazards and risks to sustainability in the Colorado River Basin
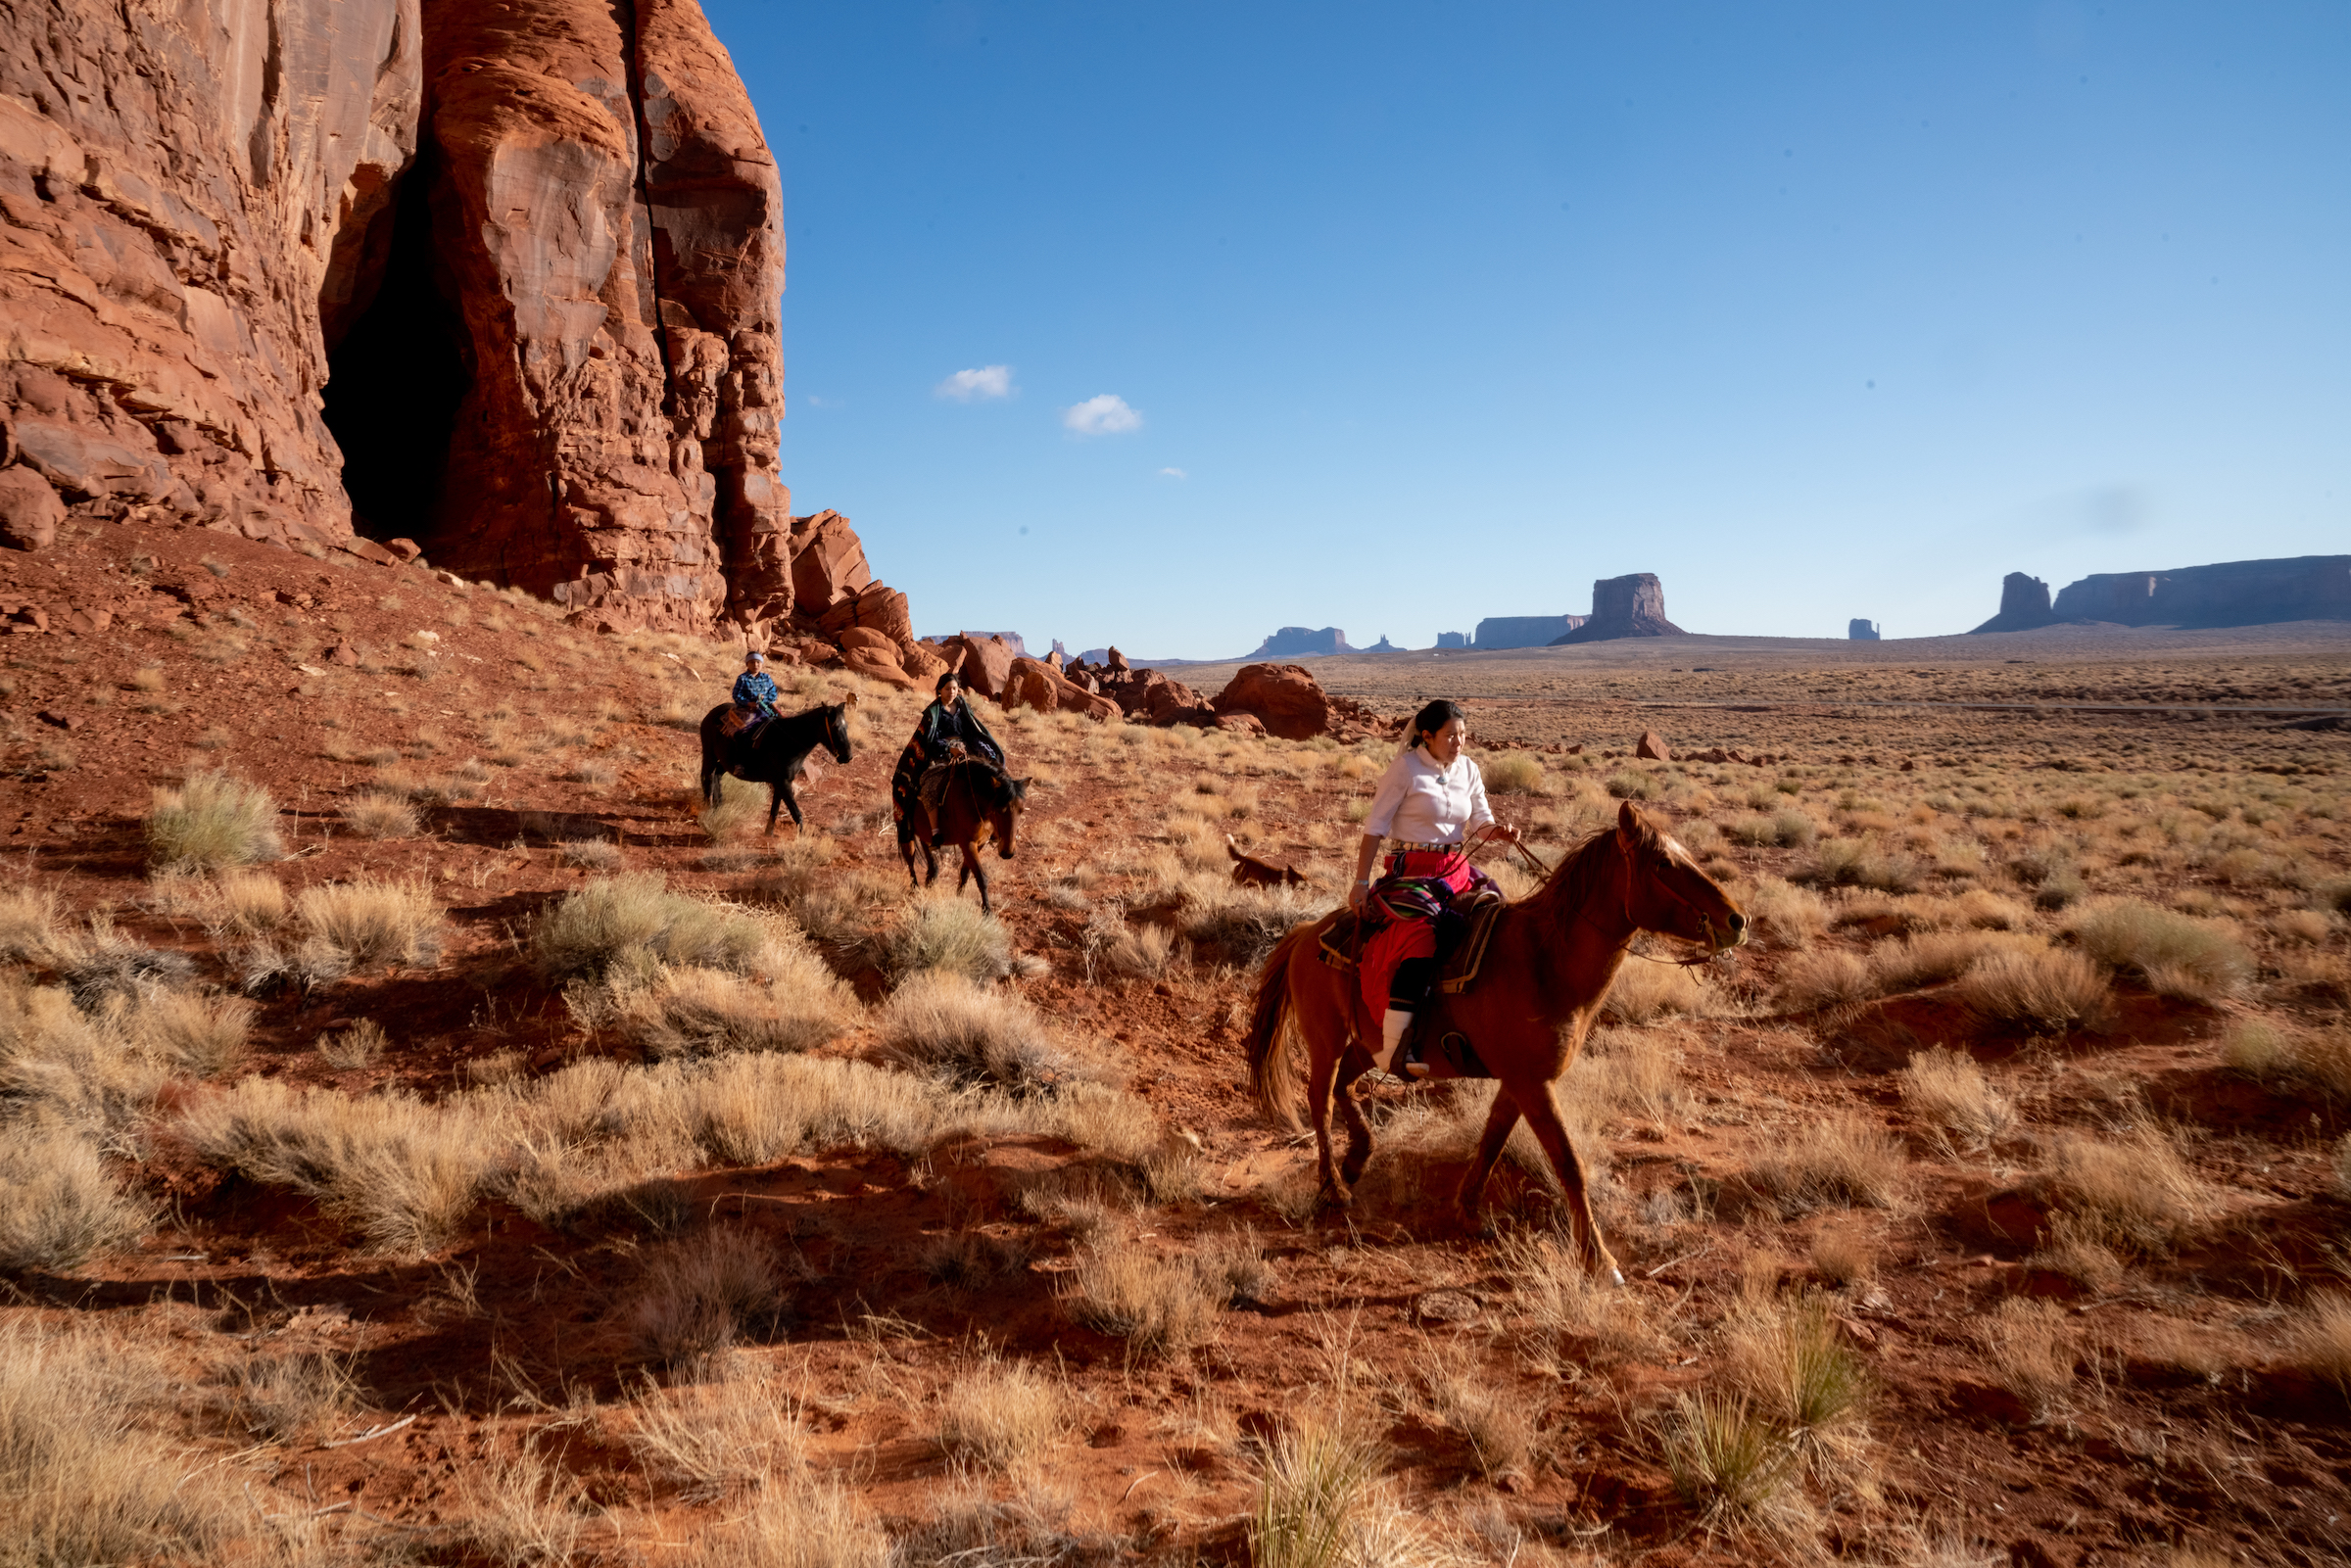
Almost every day, the news gives evidence that the Colorado Basin region is susceptible to destructive and deadly hazards—especially extreme heat, drought, and wildfire—that create serious challenges for local and federal land and water managers there. Most troubling, these hazards are getting more frequent and more severe, prompting important questions: what is the overall potential for negative impacts, or risk Definition from hazards in communities that rely on the Colorado River? What specific characteristics increase or decrease that risk?
With those questions in mind, we will now look at the CRBAAS Definition through the lens of the two main contemporary concepts for understanding risk: social vulnerability Definition—the traits and conditions that make a social group susceptible to harm or loss; and community resilience Definition—how social groups maintain functions or recover in the face of disruptions (Bergstrand et al. 2015 Citation). In general, vulnerability amplifies risk, while resilience mitigates risk. How vulnerable are communities in the Colorado River Basin to the negative impacts of hazards? Which hazards are driving risk for CRBAAS communities? How resilient are they? How does the interplay between these two factors affect the general degree of risk in a community or area? How does the CRBAAS compare to the rest of the US?
These are complex analytical questions with no universally agreed-upon assessment metrics. However, the Federal Emergency Management Agency’s (FEMA’s) National Risk Index (NRI) Definition is a well-established framework for understanding community risk. The NRI allows us to explore these conditions by comparing regions and, importantly, tracking them over time across the CRBAAS.1
In keeping with this report’s theme, we are particularly interested in the implications of hazards for the management of water and land resources. Given the increasing prevalence and severity of natural hazards in the aridifying West, communities must find ways to reduce their overall risk by adopting policies and programs that do one or more of the following: increase community resilience, reduce social vulnerability, or decrease their exposure to risks (and losses) caused by natural hazards. Using the NRI to characterize reference conditions for community resilience and social vulnerability in the CRBAAS will enable us to track risk over time, highlighting places where risk reduction is occurring and seeing what programs and policies have contributed to it.
What Is the FEMA National Risk Index?
The NRI composite risk score Definition comprises three primary components or sub-indicators as shown below. The first two terms—Expected Annual Loss Definition and Social Vulnerability—are both “consequence enhancing” components of risk, meaning that all else being equal, the higher the score, the higher the NRI for a given community and thus the greater the risk level. Community Resilience, the third term, has the opposite effect: it reduces the negative consequence of hazards by mitigating the first two variables. If all else is equal, the greater a community’s resilience score, the lower its NRI will be and the lower the overall risk.
Expected Annual Loss is a natural hazards component that represents the average economic loss in dollars resulting from natural hazards each year.
Learn more >Social Vulnerability is a consequence enhancing risk component and community risk factor that represents the susceptibility of social groups to the adverse impacts of natural hazards.
Learn more >Community Resilience is a consequence reduction risk componenet and community risk factor that represents the ability of a community to prepare for aniticipated natural hazards, adapt to changing conditions, and withstand and recover rapidly from disruptions.
Learn more >The Risk Index represents the potential for negative impacts resulting from natural hazards.
Like each of the three component indices, the NRI score is not an absolute measurement (i.e., relative to a common baseline of zero). Instead, it is “a unitless index and represents a community’s relative risk in comparison to all other communities at the same geographic level,” which are either census tracts or counties. The lower the NRI score, the less potential for negative impacts resulting from natural disasters. Numeric values are sorted by FEMA into standardized qualitative rating categories ranging from “very low” to “very high.” For our analysis, we clipped the national-scale data at both the census tract and county levels to the geographic extent of the CRBAAS.
The NRI contains 18 different types of hazards. Climatic and weather-related hazards such as drought, heat and cold waves, flooding, and wildfire are not the only hazards in CRBAAS counties and census tracts, but they are often very important. They are also unevenly distributed geographically. For example, heat wave risk is largely limited to lower-elevation areas in the Lower Basin, whereas drought, riverine flooding, and wildfire risks are prevalent throughout the region. The NRI incorporates these variations by deriving an integrated (or composite) score from the risk ratings of all the applicable hazards that have sufficient data to be calculated each unit, whether county or census tract. Therefore, each county or census tract has a risk score and rating for each hazard as well as a composite score across all hazards.
In line with the overall goal of this report, we used the NRI to establish a reference point from which to evaluate future change. Our investigation of the NRI and component indices is driven by these questions:
-
What areas of the CRB have the greatest risk overall?
-
Where is resilience highest and lowest?
-
Where is vulnerability highest and lowest?
-
What deeper questions do these data raise?
Such high-level diagnostic questions can only trace symptoms; more work is necessary to understand and change the root causes that negatively affect risk, social vulnerability, and community resilience. We explored the NRI at the county and census tract levels across the CRB. While we did not conduct hazard-specific analyses, we do use wildfire as an example below. More detailed hazard-specific indicators are being developed for future versions of this report.
We look first at the overall NRI composite risk score for the CRBAAS and then examine social vulnerability and community resilience, which provide some clues about the variation we see.
Indicator 20: Average Composite Risk Score
58.4
CRBAAS Counties have higher risk than most Counties in the US
First, we can see how the CRBAAS compares to the rest of the continental US. The average score (average of national percentile score) of CRBAAS counties is 58.4, which is above the national average of 50 as shown in the figure below. However, much of this risk comes from the Lower Colorado counties, with an average composite risk score of 23.17, and 21 out of 34 Lower Colorado counties are in at least the 90th percentile of national risk scores. Conversely, the Upper Basin has an average composite risk score of 5.57. The Adjacent Areas Served (AAS) Definition is slightly above the national average, with a mean composite risk score of 15.91.
Composite Risk CRBAAS Counties By State
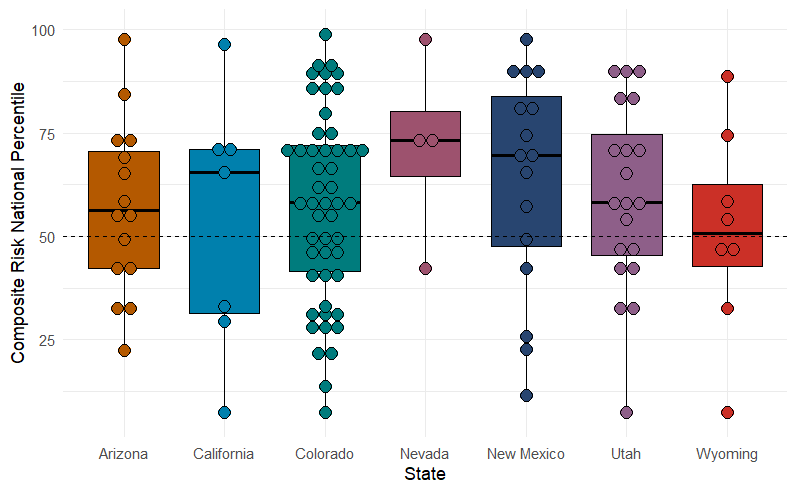
Using the zoom function in the map below, we can more closely compare the Upper and Lower Basins. Several things immediately jump out from these maps, depending on which level of analysis we look at. Comparing the states at the county level, nearly all of Arizona is classified as Relatively High Risk,2 with some exceptions in the upper Gila River Basin in the southeastern part of the state. All the CRBAAS areas in California are either Relatively High or Very High. The high composite risk scores in Arizona and California are broadly driven by high Expected Annual Losses due to high property values in areas that are particularly prone to costly natural hazards such as wildfire, or high exposure of agricultural values to costly disasters like heatwaves and drought. Around the Arizona cities of Flagstaff and Prescott, for example, wildfire is by far the most economically damaging hazard, on the order of several million dollars for some census tracts. Located just southwest of Prescott, census tract 0007000 in Yavapai County has an EAL of $3.8 million, which is almost completely attributable to wildfire.
Toggling from county to census tracts in the map below reveals more local-level variation, painting a more complicated picture. First, the Lower Basin is not as uniformly red, and the Upper Basin is less blue than county data suggest. These differences appear to hinge in large part on rural-urban divides. In the Lower Basin, urban areas stand out as islands of lower risk in a sea of yellow, orange, and red. The major Lower Basin urban areas of Las Vegas, Phoenix, Tucson, and San Diego—where much of the Lower Basin population lives—have the lowest NRI. Similarly, the cities of Denver, Colorado Springs, and Santa Fe have some of the lowest NRI values in the Upper Basin. However, cities are not always lower risk. Interestingly, the Salt Lake City–Provo and Los Angeles metros did not compare as favorably as did those other major metro areas.
‘the map below’
(in the web report, the map is below the text, although here it’s placed above the text, fyi)
In much of the CRB, the higher risks at the county level are apparently driven by the more rural areas where farming is more common or concentrated. For example, much of Pinal County, AZ, between Phoenix and Tucson, is High Risk. Although the NRI does not indicate this, it suggests that water users here are low priority for the entire Colorado Basin in terms of water allocation during drought. Similarly, the heavy agricultural areas of Imperial and Coachella Valleys drive the higher NRI scores in that region. Also, in the Adjacent Areas Served along the Front Range (Platte and Arkansas Rivers) and New Mexico (Rio Grande River), the risk seems highest in the agricultural areas the farthest downstream along these rivers. Overall, the census tract view suggests that rural and agricultural areas have the most critical need for action to reduce social vulnerability and increase community resilience.
The three components of the NRI—Social Vulnerability, Community Resilience, and Estimated Annual Losses—shed more light on what accounts for these higher-level patterns.
Indicator 21: Average Social Vulnerability Score
56
CRBAAS Census tracts have higher vulnerability than most census blocks in the US
The national map of Social Vulnerability scores shows clearly that the CRBAAS contains some of the largest areas of Very High Social Vulnerability in the US. These census tracts (shown in darkest green) are more susceptible to the negative impacts of natural hazards than 99% of the census tracts in the country. What variables drive these values? According to the University of South Carolina’s Hazards and Vulnerability Research Institute, eight of the 29 measured variables are the most important in explaining the index scores: wealth; race and social status; elderly residents; Hispanic ethnicity and residents without health insurance; special needs individuals; service industry employment; Native American populations; and gender.
NRI Social Vulnerability Score – Census Tract
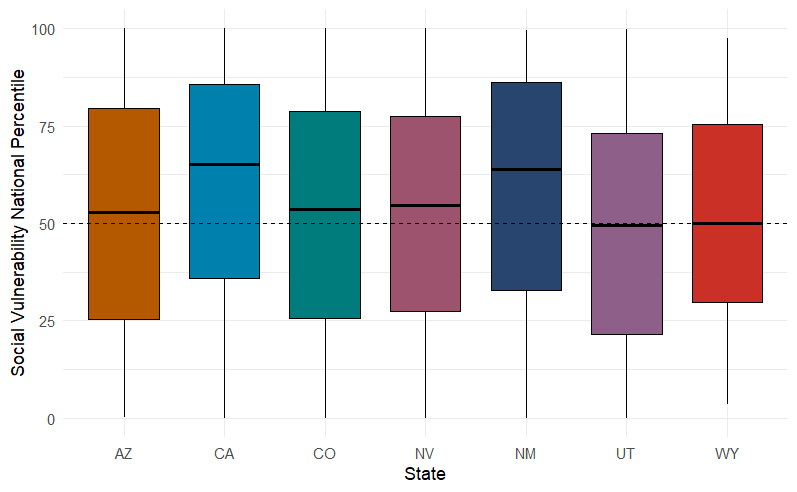
The average score of all the census tracts within the CRBAAS boundary—32.17—is slightly lower than the national average of 38.35. This is largely attributable to census tracts in Colorado, Utah, and Wyoming, many of which have lower scores than the national average. Many but not all areas of high social vulnerability in the CRBAAS exist on tribal lands that have long histories of socioeconomic exploitation and marginalization.
Use the zoom function in the above map to get a close-up view of metro Phoenix. The geographic variation corresponds with what we know about different areas. For example, the dark green areas on the east and southwest of the region indicate tribal reservations. The light green areas in the northeastern portion of the metroplex represent some of the state’s highest concentrations of wealth. And the cluster of Very High tracts in the northwest corresponds with Sun City, a retirement community with a high concentration of elderly individuals. Age is a particularly important variable because it ties so closely to vulnerability to extreme heat, a very common hazard in this region.
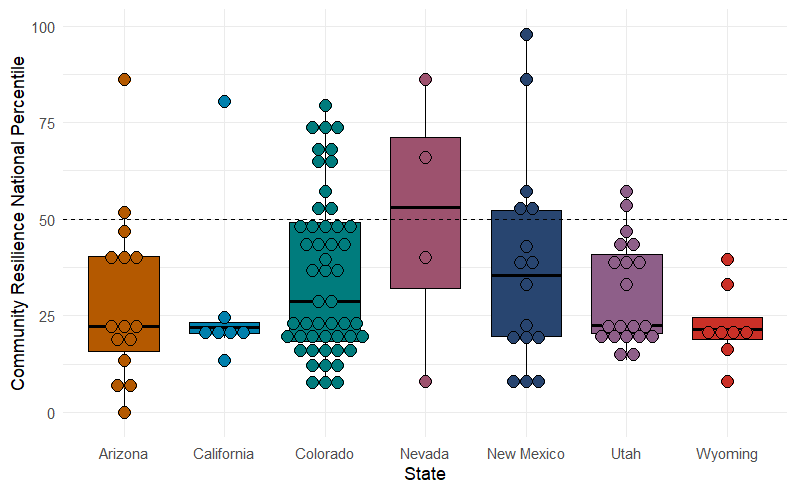
Indicator 22: Average Community Resilience Score
33.4
CRBAAS Counties have lower resilience than most Counties in the US
The source data for the Community Resilience sub-index in the NRI is the University of South Carolina’s Hazards and Vulnerability Research Institute (HVRI)’s Baseline Resilience Indicators for Communities (HVRI BRIC). It is derived from 49 variables grouped into six different kinds of “capital”: human well-being/cultural/social; economic/financial; infrastructure/built environment/housing; institutional/governance; community capacity; and environmental/natural.3 The most recent available dataset is from 2015. As noted above, in the NRI equation, Community Resilience mitigates the effects of Social Vulnerability and economic losses; therefore, higher values are better.
Looking at the map below, we can tell that very few counties have high resilience scores. In fact, almost the entire Lower Basin of the CRBAAS is either relatively or very low, and no counties have relatively high or very high scores. With an average score of 52.28, the entire CRBAAS ranks slightly lower than counties’ national average of 54.59.
Community Resilience scores are on average higher in the Upper Basin than in the Lower Basin, with several counties rated “Relatively Moderate.” Counties in the Lower Basin have lower resilience scores than the Upper Basin’s or the Adjacent Areas Served. Two examples are Clark County (which contains metro Las Vegas) and Lincoln County, to the north of Clark. In California, Imperial County’s rating is Very Low. In Arizona, eight counties (more than half the counties in the state) rank Very Low. While the counties with the lowest community resilience in the state are predominantly rural/tribal communities, the urban areas (namely, Maricopa and Pima Counties) are not significantly more resilient, and both have Relatively Low scores.
NRI Community Resilience Score – County
Risk Index Illustrative Comparison: Imperial County, CA, and Pinal County, AZ
So far, we have mainly looked at the NRI from a Basin-wide perspective. This big-picture view can be deepened by zooming in to specific areas. To illustrate the utility and greater depth of the NRI, we ran a query using FEMA’s NRI tools to compare two seemingly similar counties: Pinal County, AZ, and Imperial County, CA.4 Both are relatively rural with some urban islands, similar climates, and economies dominated by irrigated agriculture. Both are very reliant on Colorado River supplies for that irrigation. But beyond these broad similarities, how do they compare from a risk and vulnerability standpoint?
Comparing Pinal County to the rest of the US, its Risk Index score of 28.6 is Relatively High. Why might that be? A key factor is that its Expected Annual Losses (EALs) are Relatively High: 97% of US counties have a lower EAL than Pinal County does. Remember that EAL is a composite value based on multiple hazard-specific values that estimate the economic impact of hazards each year. The composite EAL for Pinal County is about $60 million, mainly due to the hazards specific to agriculture: nearly $51 million expected annual loss. That accounts for about 85% of the total EAL.
Next, we can consider what types of hazards contribute to this estimate and which are more detrimental than others. The main hazards in Pinal County are drought, heat waves, and, perhaps surprisingly given the desert climate, flooding. Of the three, drought accounts for the biggest share by far ($47,672,627) and is rated Very High. The Drought Risk Comparison Map below shows that, in the entire Colorado Basin, Pinal County is among the places most susceptible to the impacts of drought, along with other areas in northeast and southeast Arizona.
Flooding and Heat Wave are both rated Relatively High, with EAL contributions estimated at $2,287,858 and $852,570, respectively. Adding to EAL the values for Social Vulnerability (Relatively Moderate) and Community Resilience (Relatively Low) in the NRI equation, it begins to make sense that Pinal County has a Risk Index rating of “Relatively High.”
Next, we can ask: is this area more risk-prone than other desert agriculture areas in the CRBAAS, such as Imperial County, CA? The graph below shows key NRI variables and hazards in Pinal and Imperial Counties.
Risk Snapshot: Imperial and Pinal Counties
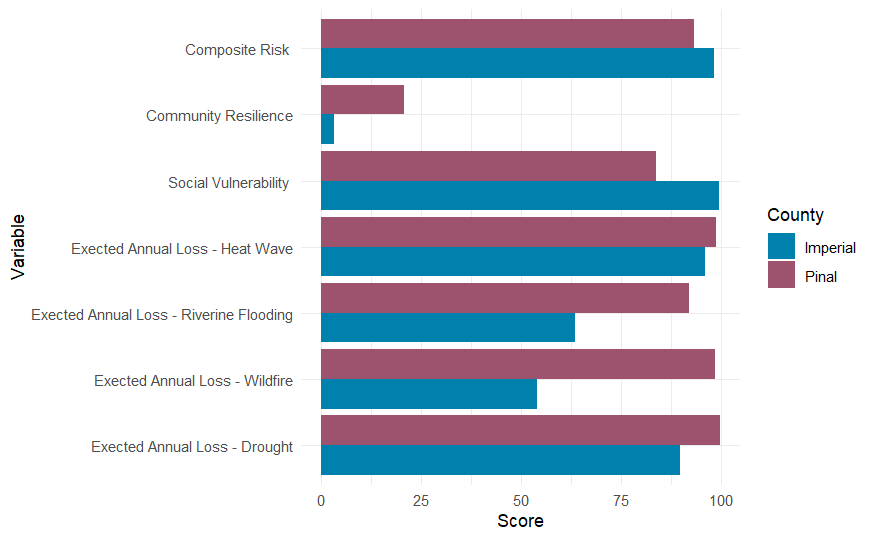
The two counties are similar in that they both have relatively high composite EAL scores, though Pinal’s is slightly higher. They experience most of the same types of hazards (except for earthquakes!), but to varying degrees. Both counties score relatively high for Heat Wave, but generally, Pinal has higher risk scores than Imperial for these different hazards, especially drought. Interestingly, Imperial’s drought risk score is quite low. Even though the economic value of agriculture is much higher in Imperial than in Pinal, EAL due to drought is far higher in Pinal ($48 million) than in Imperial (only $29,000). Additional data on these two regional farm economies (for example, the proportion of crop versus livestock operations) would be needed to fully account for this apparent contradiction. However, using the NRI to identify more specific analytical questions demonstrates its utility as a first-level comparative and diagnostic tool.
Based on EAL alone, we might expect that the overall Risk Index would be higher for Pinal. Why isn’t that the case? One factor is that Imperial County has a lower score in Community Resilience (45.46, Very Low) than Pinal (50.69, Relatively Low), though the most striking difference is that Imperial has a much higher Social Vulnerability score: 61.37 (Very High) compared to 37.45 (Relatively Moderate). Combined, these factors help us better understand why Imperial has a much higher overall Risk Index score: 43.82 compared to 28.6 (Relatively Moderate) for Pinal.
What are the implications of this? This simple comparison shows how the appropriate strategies for reducing the Risk Index in these two areas might be rather different even though the communities seem very similar in some major respects. The information raises useful questions such as, why is Social Vulnerability so high in Imperial County? And why does Pinal County agriculture seem more prone to drought-induced economic losses? The answer to the first question might lie in socioeconomic variables; for the second, we might investigate how farmers in Pinal County are the first to be cut off from Colorado River supplies during drought—which is currently happening—and the negative risk implications that raises.
We invite you to explore the region in more detail using our CRB-specific map viewer, as well as the FEMA NRI explorer, which allows you to replicate queries such as the one we have described here.
Summary of Risk, Vulnerability, and Resilience in the Colorado River Basin
Our goal in reporting the NRI was to establish reference values for Risk Index, Social Vulnerability, and Community Resilience specifically for the CRBAAS. Overall, even a cursory look at the NRI for the CRBAAS shows highly concerning reference values. The region contains many counties with high NRI scores, high scores for social vulnerability, and low community resilience scores compared to those in the rest of the US. The Lower CRB stands out not only within the larger CRB but in the entire US as a critical area of social vulnerability and high risk of suffering negative economic impacts from hazards, especially drought, extreme heat, fire, and post-fire flooding. This should be especially troubling considering that all these hazards are likely to worsen with a warmer climate.
What would progress relative to this baseline look like? Ideally, NRI scores should decrease over time across a growing total area of the CRB. Remember, NRI is a relative value, not an absolute. Put simply, we want to see more of the CRBAAS in blue. That would mean that the Lower Basin is taking actions that increase Community Resilience while reducing Social Vulnerability, putting those scores more on par with the Upper Basin’s and other areas of the US with relatively lower NRI. Our comparison of Pinal and Imperial Counties suggests that applying the NRI and component indices should prompt an initial high-level diagnosis of risk followed by more granular questions and investigations of specific areas. In turn, resources, planning, and programming at administrative and jurisdictional levels will, ideally, be mobilized to ameliorate specific causes of low resilience and high vulnerability.
Certainly, great work is happening in specific areas and communities across the CRBAAS that relate to the socioenvironmental issues these indices encompass but that we cannot survey here. Rather, we aim to establish a baseline and track change Basin-wide. In future iterations of this report, we will expand data and analysis to more comprehensively cover indicators related to specific hazards in the CRBAAS as well as to climate change, the driver of current and future challenges. As noted by FEMA, the NRI is appropriate for broad comparisons but is not a substitute for localized risk analysis.5 It is useful as a high-level diagnostic tool although it primarily focuses on economic impacts. NRI ratings can help communities prioritize and allocate federal resources, educate residents and prospective homeowners about natural hazards, enhance hazard mitigation planning, encourage community-level risk assessments, support the development of hazard-related codes and standards, and inform long-term community recovery.6