Water Utilities: Conservation Versus Cost
Assessing the challenge for water utilities to serve growing populations while navigating financial and resource management goals
Water utilities that serve growing populations have a difficult job navigating conflicting financial and resource management goals. On the one hand, they must generate enough revenue to ensure a safe and reliable water supply while covering the growing costs of treatment, conveyance, infrastructure, and new supplies to meet the demands of new residents. On the other hand, they must do all that at the lowest possible cost to ratepayers, while often encouraging ratepayers to adopt conservation measures that reduce water use, and consequently, revenue (Chestnutt et al. 2013 Citation).
The challenge for utilities is even greater in the water-stressed Colorado River Basin, which is in its 23rd year of drought Definition (Williams, Cook, and Smerdon 2022 Citation). In many western communities, water demand is projected to exceed available surface water in the coming years, requiring communities to find new or alternative water sources or reduce demand while maintaining adequate revenue streams (McCabe and Wolock 2021 Citation).
Adopting a new water pricing system is one way water utilities can grapple with these management challenges. A given water pricing system can indicate whether and to what extent a community’s water utility prioritizes conservation relative to other priorities such as affordability and revenue.
With that in mind, we cataloged the price of utility-supplied residential potable water in 37 communities in the Colorado River Basin (CRB) Definition and Adjacent Areas Served (AAS) Definition of various sizes, growth rates, and climates. We examined three scenarios for water use—low, moderate, and high. This first study is intended to provide a reference point for water prices. The long-term goal is to continue updating this information in the years to come to see how various communities balance growth with water supply stress, and if and how conservation-oriented pricing strategies evolve in the CRBAAS Definition.
Understanding Water Pricing
Nearly all water utilities charge a base fee for service Definition. This fee is meant to recover costs associated with the utilities’ overhead, reading and maintaining meters, billing, and so forth. The utilities’ overhead costs are more or less equal across all accounts, though base fees often differ due to meter size, location, or zoning type. Customers outside of city boundaries with municipal water utilities frequently pay more than customers within the city bounds. Some utilities—including some in the Phoenix region—include a basic water allowance to meet indoor sanitary needs. Such a strategy increases the base fee but creates a revenue floor, adding stability to utility revenue that conservation measures cannot erode or reduce.
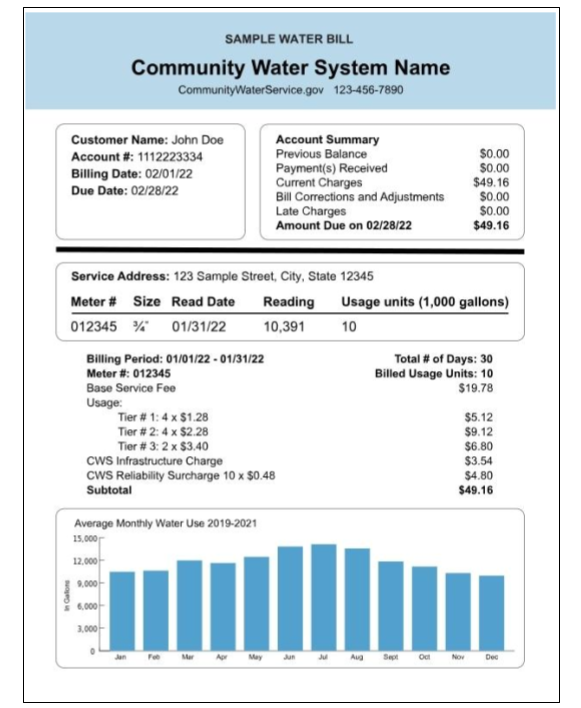
Usage or consumption charges depend on the amount of water used, which differs from customer to customer. The rate structure Definition utilities employ differs greatly depending on the costs of water supplies, conservation goals, demand patterns, and the usage characteristics of ratepayers served by each utility. There are seven types of usage rate structures: 1)flat Definition, 2)uniform Definition, 3)increasing block Definition, 4)decreasing block Definition, 5)seasonal Definition, 6)drought, and 7) water-budget based Definition or combinations of these structures.
Additional fees or surcharges (including city or state taxes, in some cases) may be levied to serve a particular purpose or raise revenue for a project. Sometimes these charges pay for new infrastructure, conservation measures, and watershed restoration, or they may be levied during droughts. These may be flat fees or per-home charges.
Water Price Indicators
We chose to examine five specific indicators of water price by examining the published prices for single-family residential water billed by a community water system Definition with a three-quarter-inch meter. This study focused on household water use, assuming three water use scenarios: low, or enough to meet basic needs for a family of four using 50 gallons per person per day over 30 days—200 gallons/household/day (GPHD) Definition; moderate: 400 GPHD; and high, or wasteful: 600 GPHD during January 2022. We assumed monthly use and did not consider differences in price due to seasonal rates, but we plan to do so in future iterations of this report. We also looked at the average base fee charged by Community Water Systems(CWS) in the CRBAAS and calculated a rate steepness coefficient, which is the slope of the line between 200 GPHD prices and the 600 GPHD prices.
Indicator 15: Average Base Fee for Service in CRBAAS Communities
$19.78 across 37 Indicator Communities in 2022
The average base service charge in the 37 CRBAAS communities was $19.78 in 2022. Communities surveyed in New Mexico had the lowest base service fees, at $15.80, and Colorado communities had the highest fees, at $20.74.
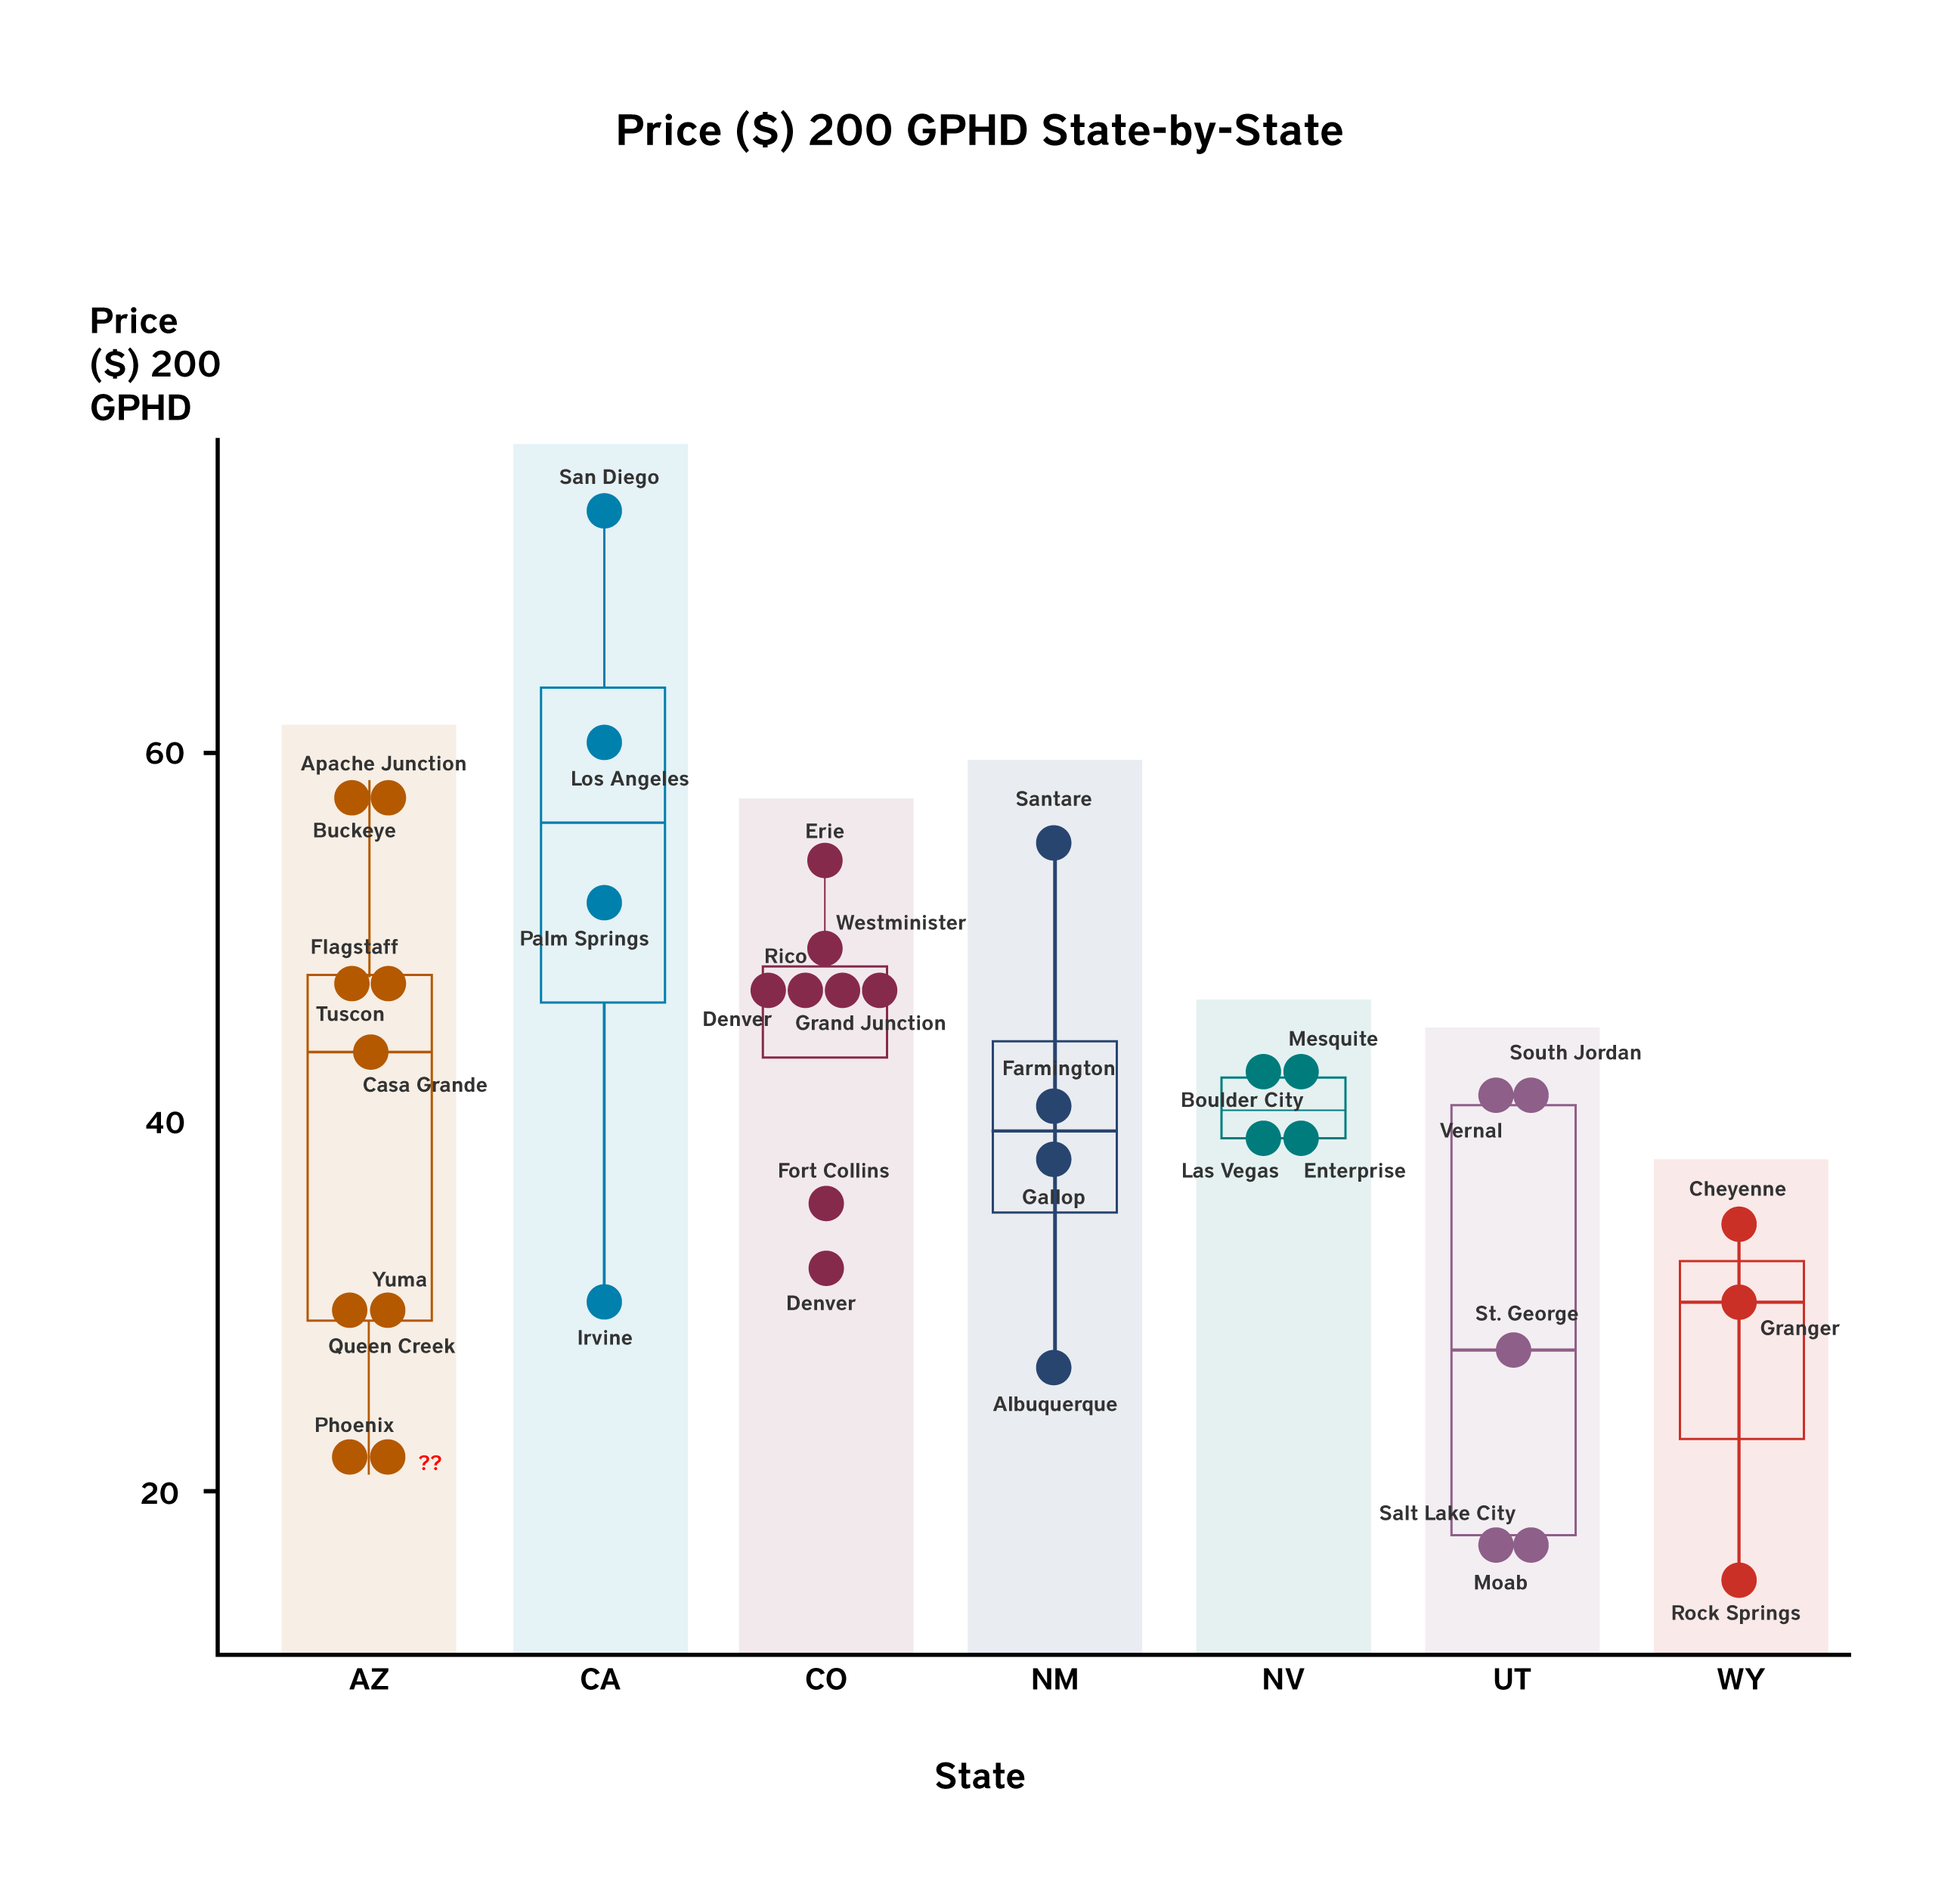
Indicator 16: Average Cost of 200 Gallons Per Household Per Day
39.83 across 37 Indicator Communities in 2022
Including usage, base service fee, and other fees, the average cost for a single-family residential home consuming 6,000 gallons over 30 days, or 200 GPHD, was $39.83.1 That represents low water use, or enough water to cover basic needs and then some.
Indicator 17: Average Price for 400 GPHD in CRBAAS Communities
$70.50
Including usage, base service fee, and other fees, the average cost of a single-family residential home consuming 12,000 gallons over 30 days, or 400 GPHD, was $70.50 in January 2022. That represents moderate water use.
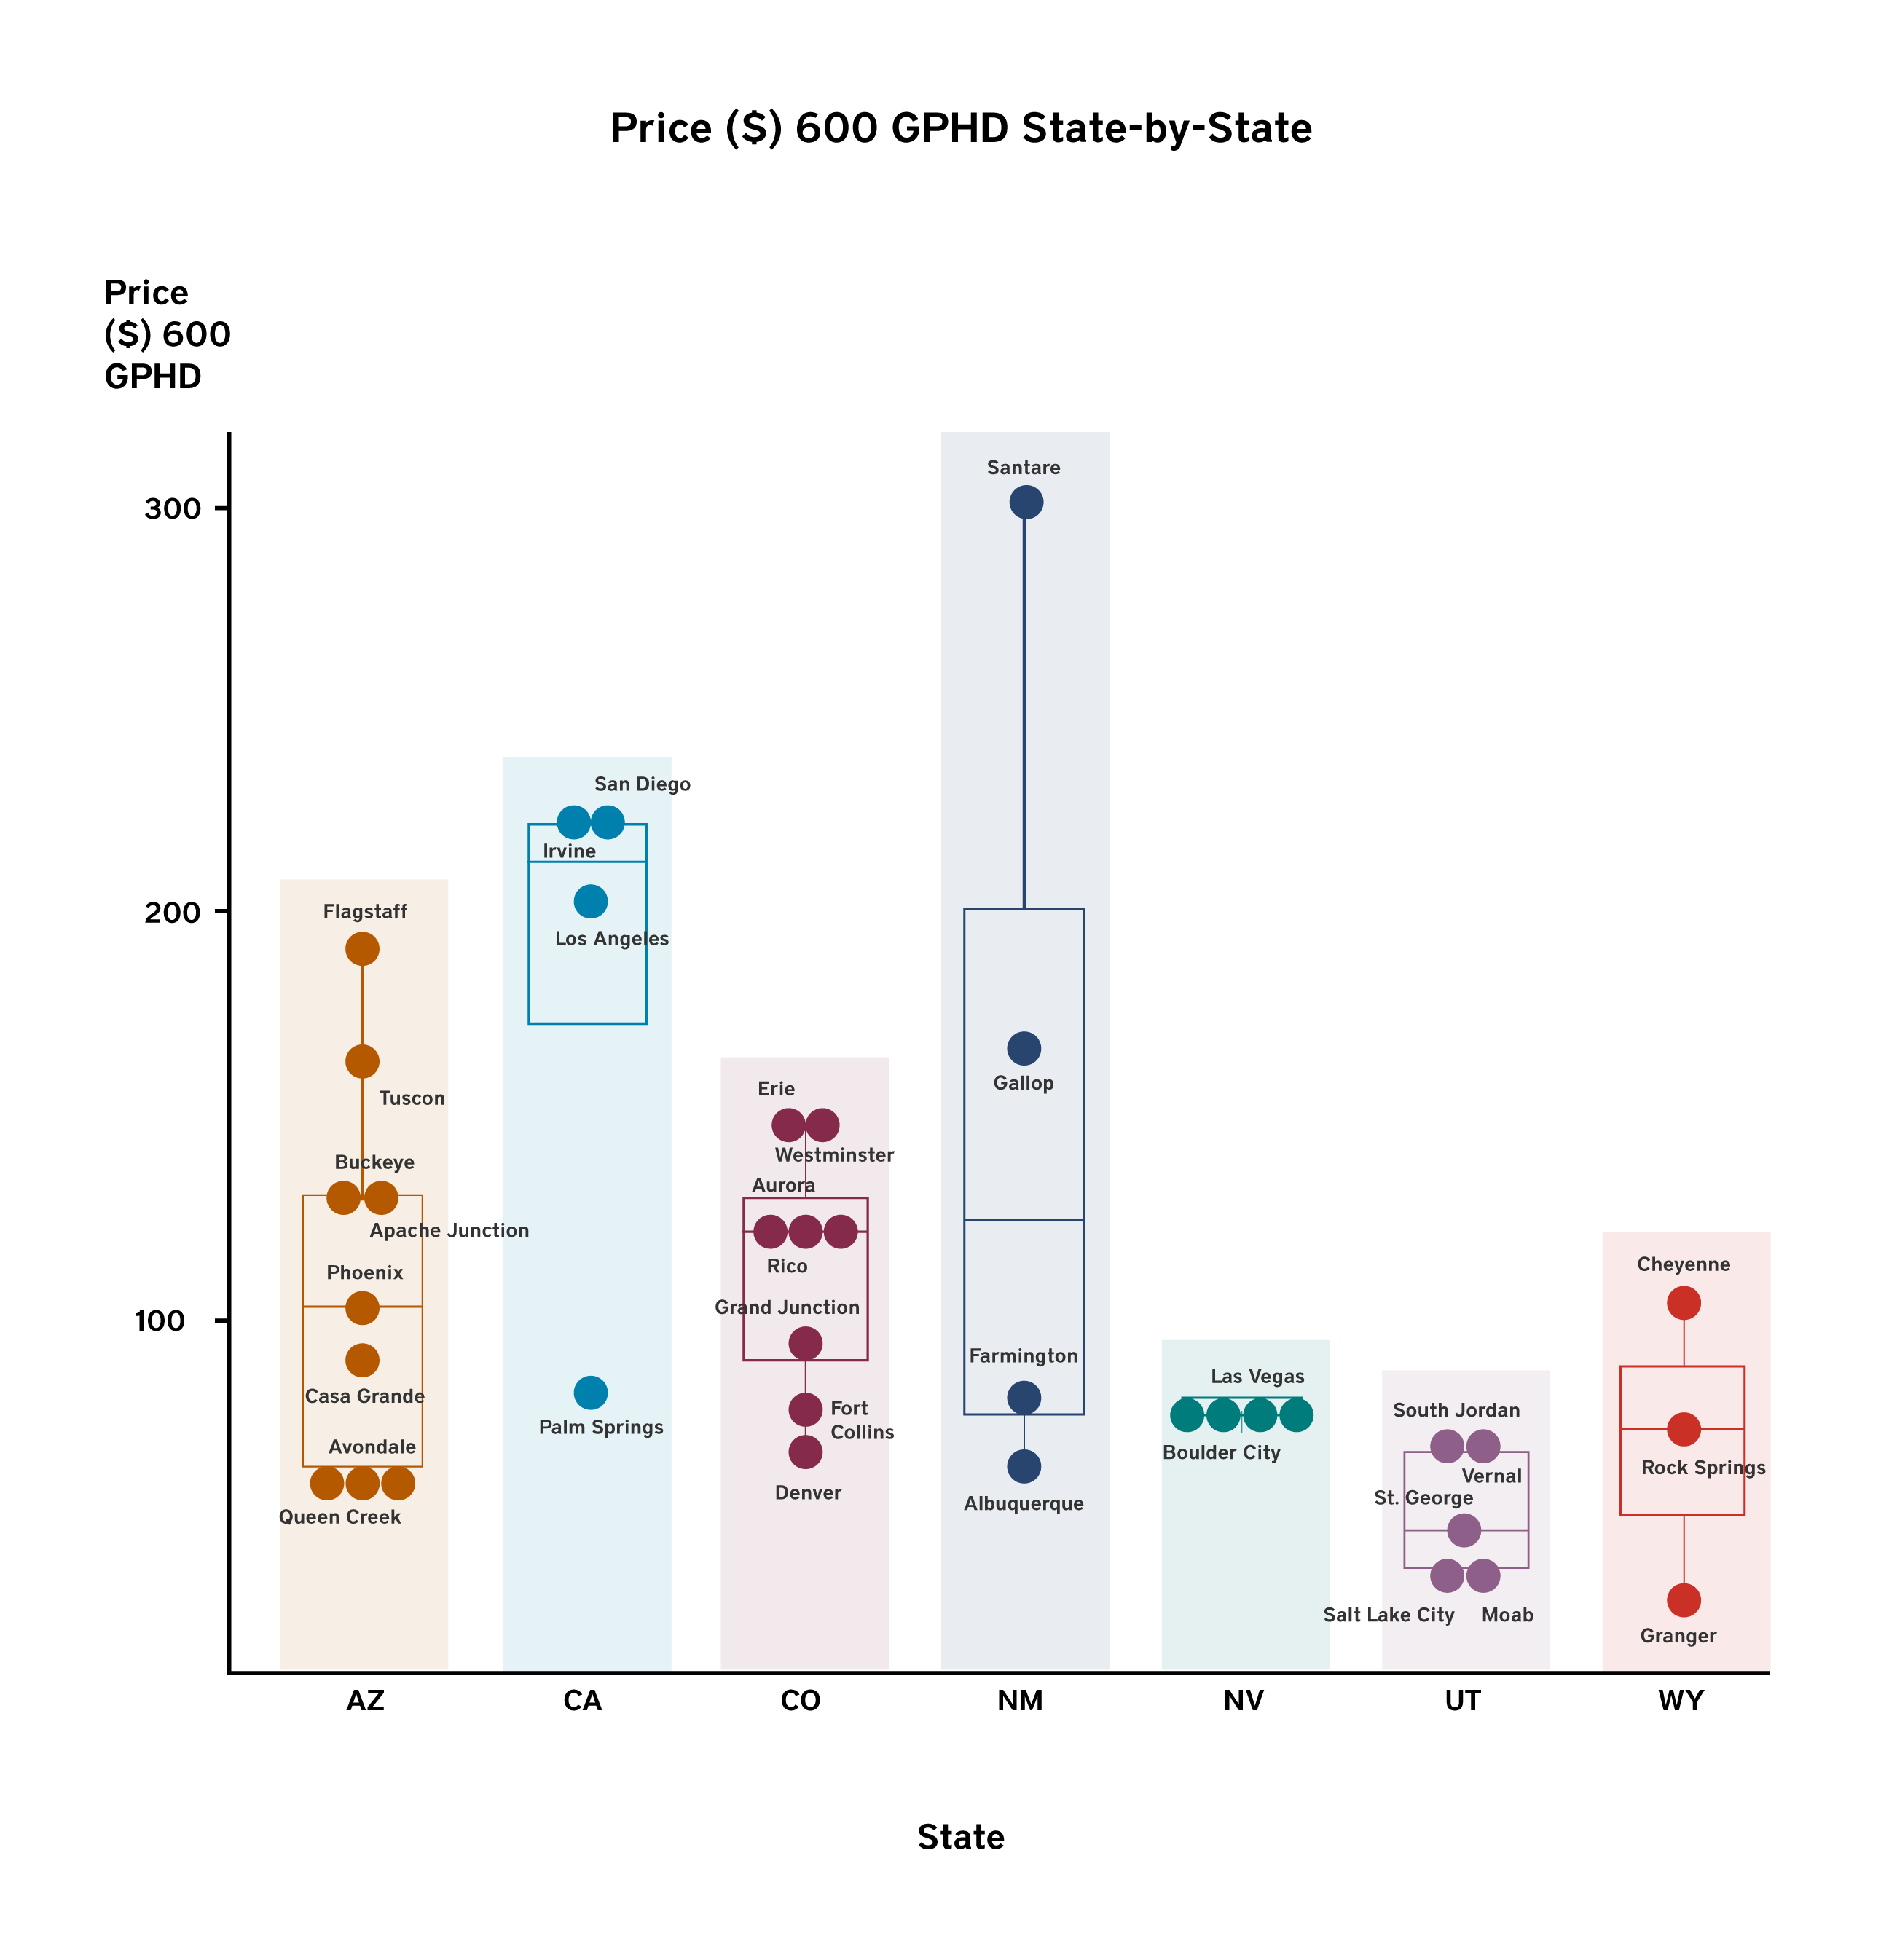
Indicator 18: Average Price for 600 GPHD in CRBAAS Communities
$107.34
Including usage, base service fee, and other fees, the average cost of a single-family residential home consuming 18,000 gallons over 30 days, or 600 GPHD, was $107.34 in January 2022. That scenario represents high water use.
Indicator 19: Average Conservation Price Slope
5.62
A rate steepness coefficient was calculated2 to measure how quickly or how steeply the price increases when consumption increases from a low or moderate volume of water to an excessive or wasteful volume of water, or to measure the change in marginal price Definition from low to very high water use. The average rate steepness coefficient for the 37 CRBAAS communities was 5.6. The steeper the slope, the higher the marginal price for each additional unit of water used. A value of 0 would be characteristic of a utility that charges a flat fee regardless of use. Granger, Wyoming, has a Conservation Price Slope of 0, which isn’t surprising given its population of fewer than 200. In small communities like this, utilities often do not generate enough revenue to pay for water meters. Values near 1 correlate with prices that increase linearly at a 1:1 ratio with use or consumption—a uniform price structure—wherein each additional 1,000 gallons used has the same unit cost as the previous 1,000 gallons. St. George, Utah, has a Conservation Price Slope of 1.6 and, while its price structure is not uniform, within its increasing block structure price increases are very modest. Santa Fe has the steepest conservation price slope value: 20.4, because the city’s price increases are very aggressive due to increasing use and a strong conservation incentive.
Rate Steepness Coefficient

Summary of Municipal Water Pricing in CRBAAS
Among our sample, California, Arizona, and Colorado had the highest water prices, and Utah and Wyoming had the lowest, with Nevada and New Mexico in the middle. Overall prices in the Basin are comparable to national averages. According to Bluefield Research, which conducted a rate study of 50 large cities that house about 20% of the U.S. population, the national average household water use was 7,230 gallons from 2012 to 2021, and the national average water bill was $45.44 per month in 2021, up about 4.3% from 2020 (Bluefield Research 2021 Citation).
Of the 37 communities examined, two used uniform fee structures, one had a flat fee regardless of the amount used, and one had a decreasing block structure in which the price per thousand gallons decreased with increased use. Thirty-two communities had some sort of tiered increasing block structure: of those, two included water budgets in determining tier structure, and three included seasonal considerations in their rate structures and/or tiers.
It’s promising that most of the CRBAAS communities have taken a tiered approach to water pricing. Studies have found that consumers often don’t realize how much water they use or are insensitive to changes in marginal price caused by their individual conservation efforts, meaning water use is relatively unaffected by price (Brent and Ward 2019 Citation). One major advantage of a tiered rate structure, however, is that most utilities do charge less than the long-term marginal cost Definition of water, but creating a tiered structure means that high water users pay a price approaching the long-term marginal cost for a scarce resource (Olmstead and Stavins 2009 Citation).
Providing safe and reliable water is costly, and those costs continue to rise. From 2012 to 2021 the price of water and wastewater in the US increased on average by 5.1% per year (Bluefield Research 2021 Citation). While asking water users to conserve water can be challenging, as their bills continue to rise, conservation through programs or indirectly through rate structures can dramatically reduce capital costs over time. Tucson, for example, estimates that lower per capita use from 1989 to 2015 led to over $350 million in avoided costs and water bills nearly 12% lower than they would have been if per capita use had remained constant (Mayer 2017 Citation). Determining municipal water rates is complicated but there are resources to help. The Alliance for Water Efficiency has a guide to building better water rates that can help communities choose a rate structure tailored to their circumstances. We will continue to monitor water prices in the CRBAAS and plan to include more indicators focusing on outdoor water use and affordability, and to include sewer costs in future reports.