Development and Land Use
How housing development patterns and land use change affect urban water use
We discuss these two factors using four indicators:
1) change in the median lot size for new homes;
2) the percentage of total housing area zoned as single-family residential;
3) the change in land cover classified as developed; and
4) forest cover change.
These four indicators were selected because the type of housing development affects both indoor and—critically in the CRBAAS—outdoor water use. In general, single-family dwellings with relatively large lot sizes consume more water than do denser developments with less irrigated outdoor vegetation (Follingstad and Troy 2022 Citation; Stoker et al. 2017 Citation; Stoker and Rothfeder 2014 Citation; Whitler and Warner 2014 Citation). Thus, tracking these variables over time should provide a sense of whether new development may be more or less water consumptive. In general, converting undeveloped land to housing stock or other urban land uses alters the movement and availability of water due to the associated expansion of impervious surfaces. Developing forested land has particularly significant implications for the timing and quality of water supply in the CRBAAS and western US. To assess changes in those variables, the third and fourth indicators in this chapter are derived from the National Land Cover Database(NLCD) Definition, a mapping effort conducted approximately every five years to characterize land cover throughout the U.S. Considering changes in developed and forested land along with housing patterns will help us form a more complete picture of the region’s urban growth and how it may be affecting water resources.
Indicator 7: Median Lot Size for New Homes in the West
6,424 Square Feet in 2021
Down from 6,969 Square Feet in 2011
Average and median lot sizes for new single-family homes have been slowly declining for years in both the United States as a whole and in the western states specifically. Lot sizes are smaller in the West than in any other region—the median declined by 7.18 percent from 2001 (7,003 square feet) to 2021 (6,500 square feet).1
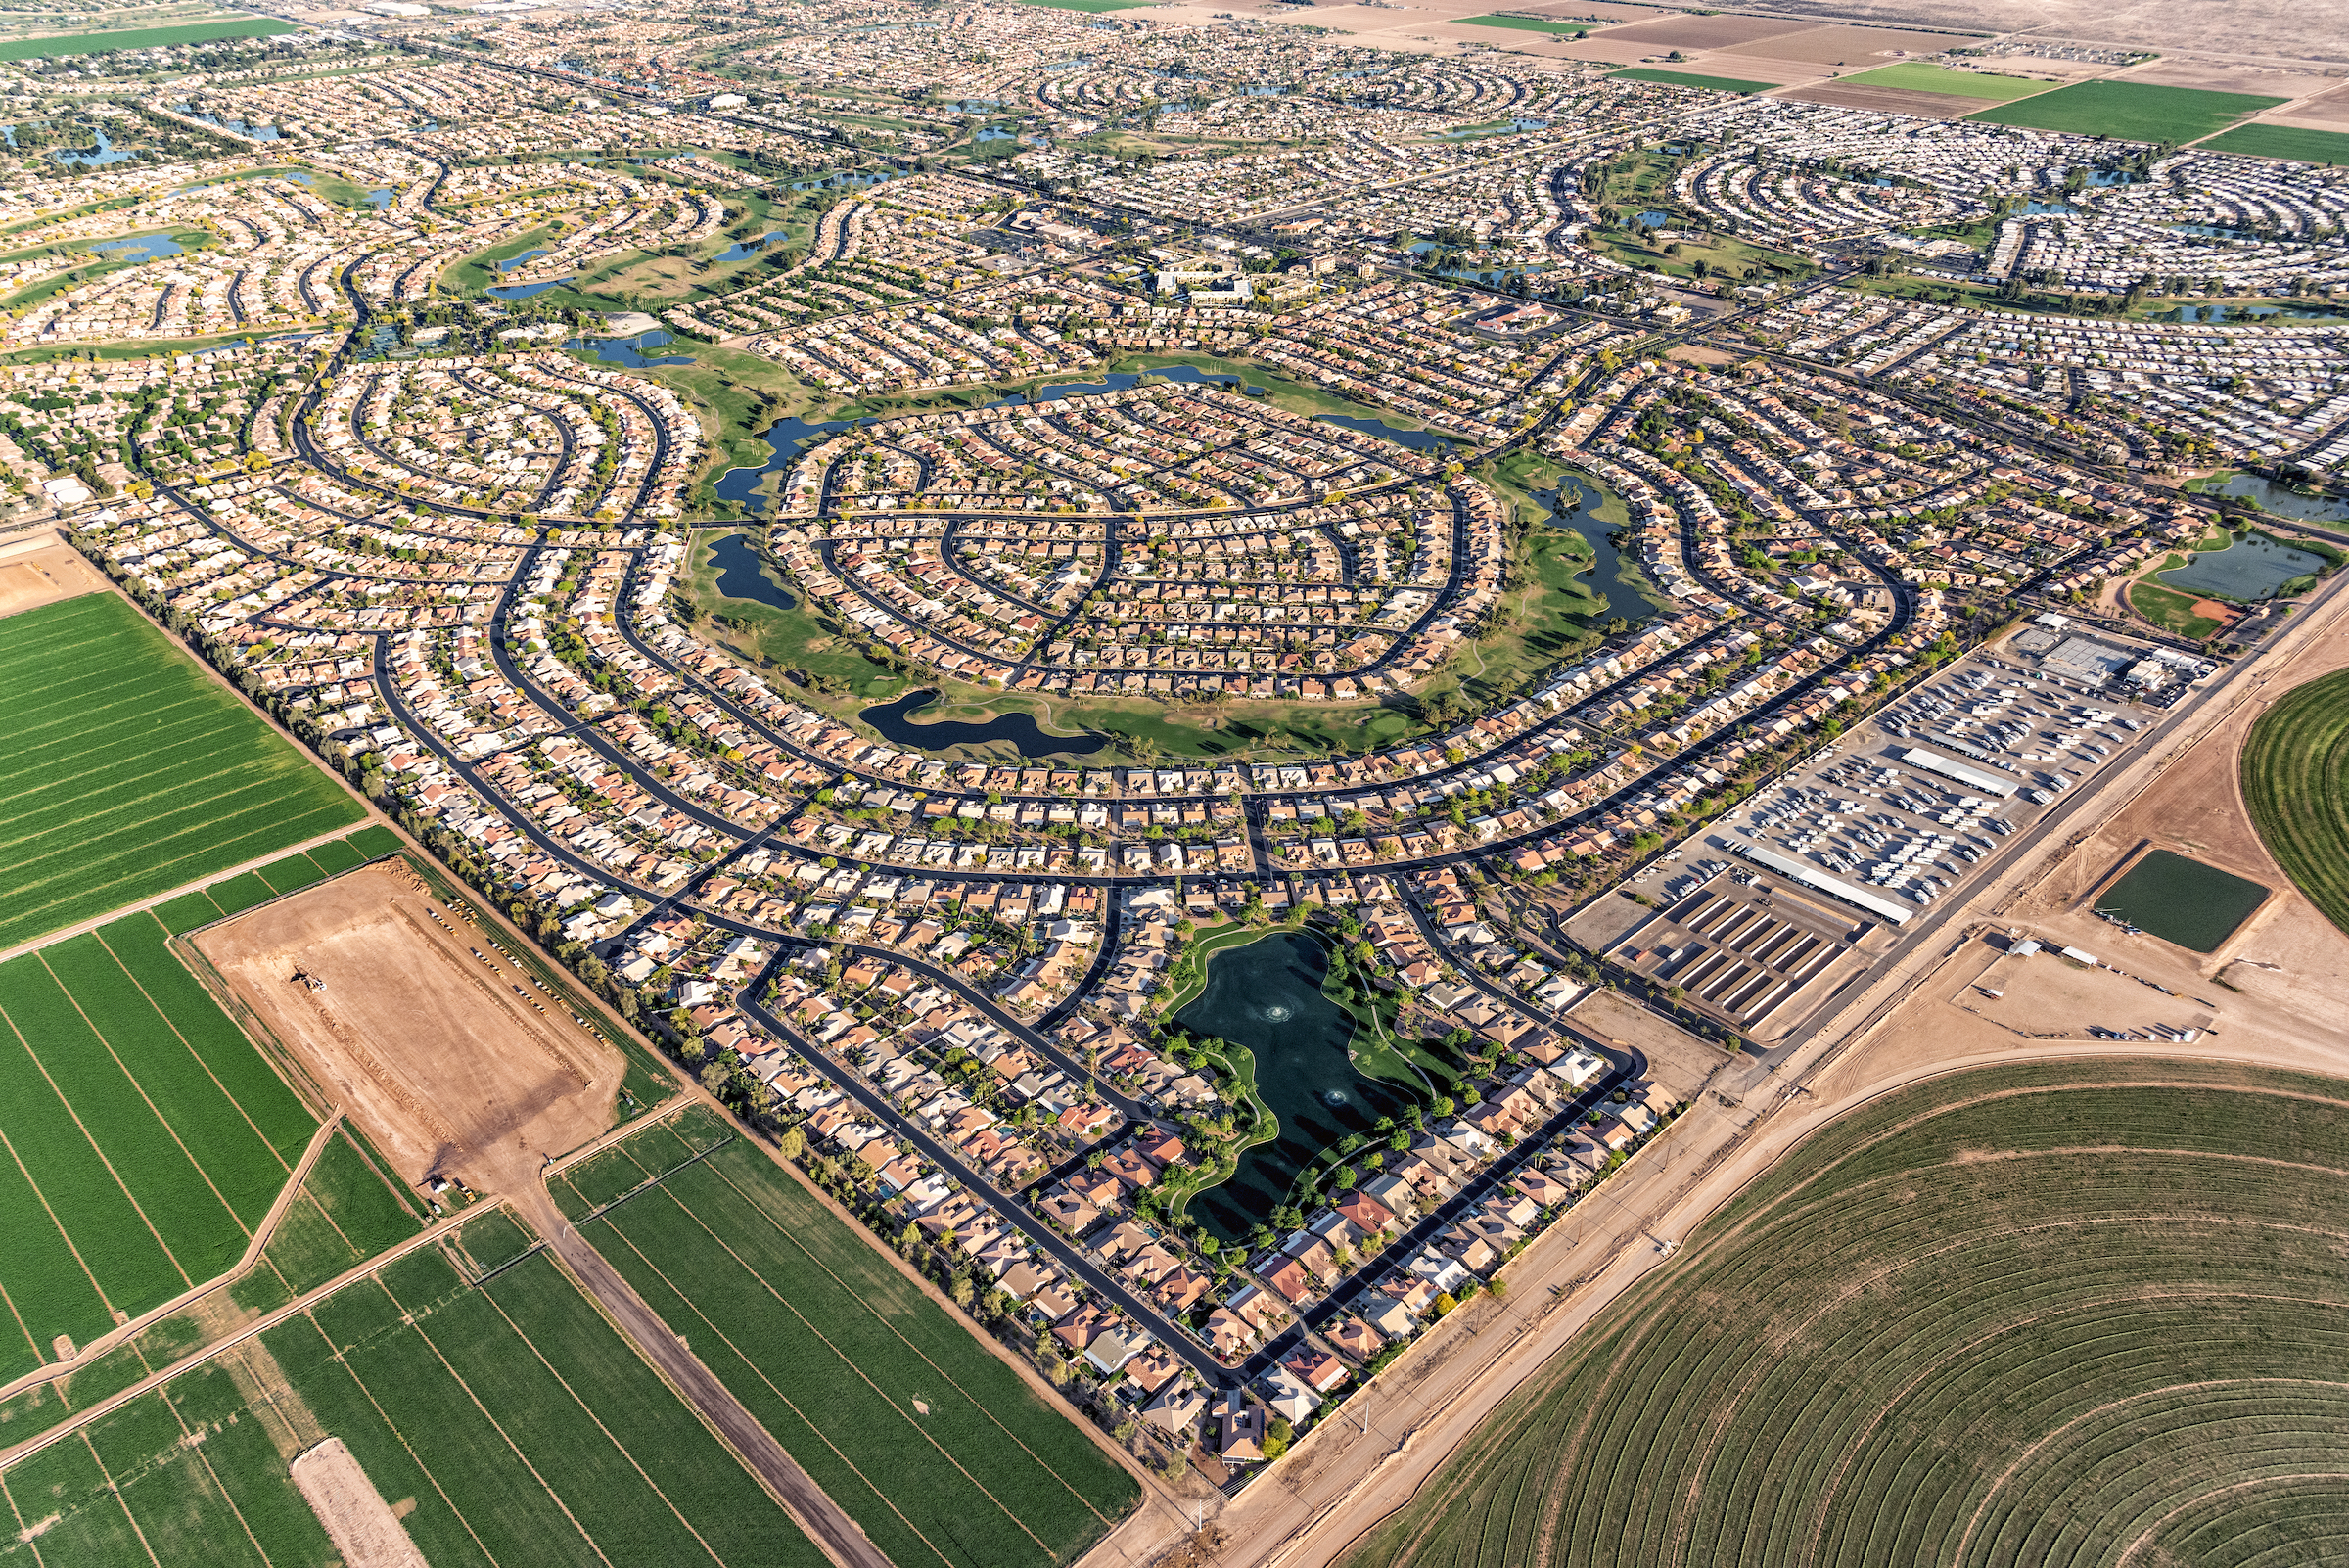
In the Southwest, the largest portion of water is used outdoors. In Arizona, outdoor water consumption comprises up to 70% of municipal water use.2 In general, larger lots use more water per house because their landscaped areas are larger (Follingstad and Troy 2022 Citation; Stoker et al. 2017 Citation; Stoker and Rothfeder 2014 Citation; Whitler and Warner 2014 Citation). Higher-density areas associated with multifamily residential zoning Definition report less outdoor water use per capita than single-family dwellings, because outdoor communal space is shared among many residents. Water demand, therefore, is tied to development patterns and densities, yet zoning is rarely put in place to regulate water use (Bates 2012 Citation; Follingstad 2022 Citation). A higher proportion of high-density housing development will improve future water demand.
Indicator 8: Proportion of Housing Zoned Single-Family
0.1 Percent Increase
Current zoning laws favor single-family, or R1 zoning, sometimes called “exclusionary zoning” because low-income families typically cannot afford to buy large plots of land or single-family dwellings (Whittemore 2021 Citation). Single-family lots tend to be bigger and thus have larger landscaped areas and higher outdoor water use. For this reason, we chose to track the proportion of new housing zoned as single family using American Community Survey data from the US Census Bureau. Based on these data, the adoption of single-family dwellings across the Basin does not represent a trend, with a 0.1% average increase at the county level.3 However, trends did vary by county. Of the 120 counties assessed, 70 showed increases in the percent of homes zoned as single family as a proportion of the total number of houses, 48 showed decreases, and two showed no change, as indicated in the map below. The counties with decreasing single-family zoning are primarily in California or rural counties. California’s legislature recently passed two bills to increase housing in the state of California (SB-94 and SB-105). These bills, which allow accessory dwelling units (ADUs) Definition on land previously zoned for single units and encourage denser development near public transit corridors, are intended to undermine exclusionary policies like single-family (R1) zoning.6
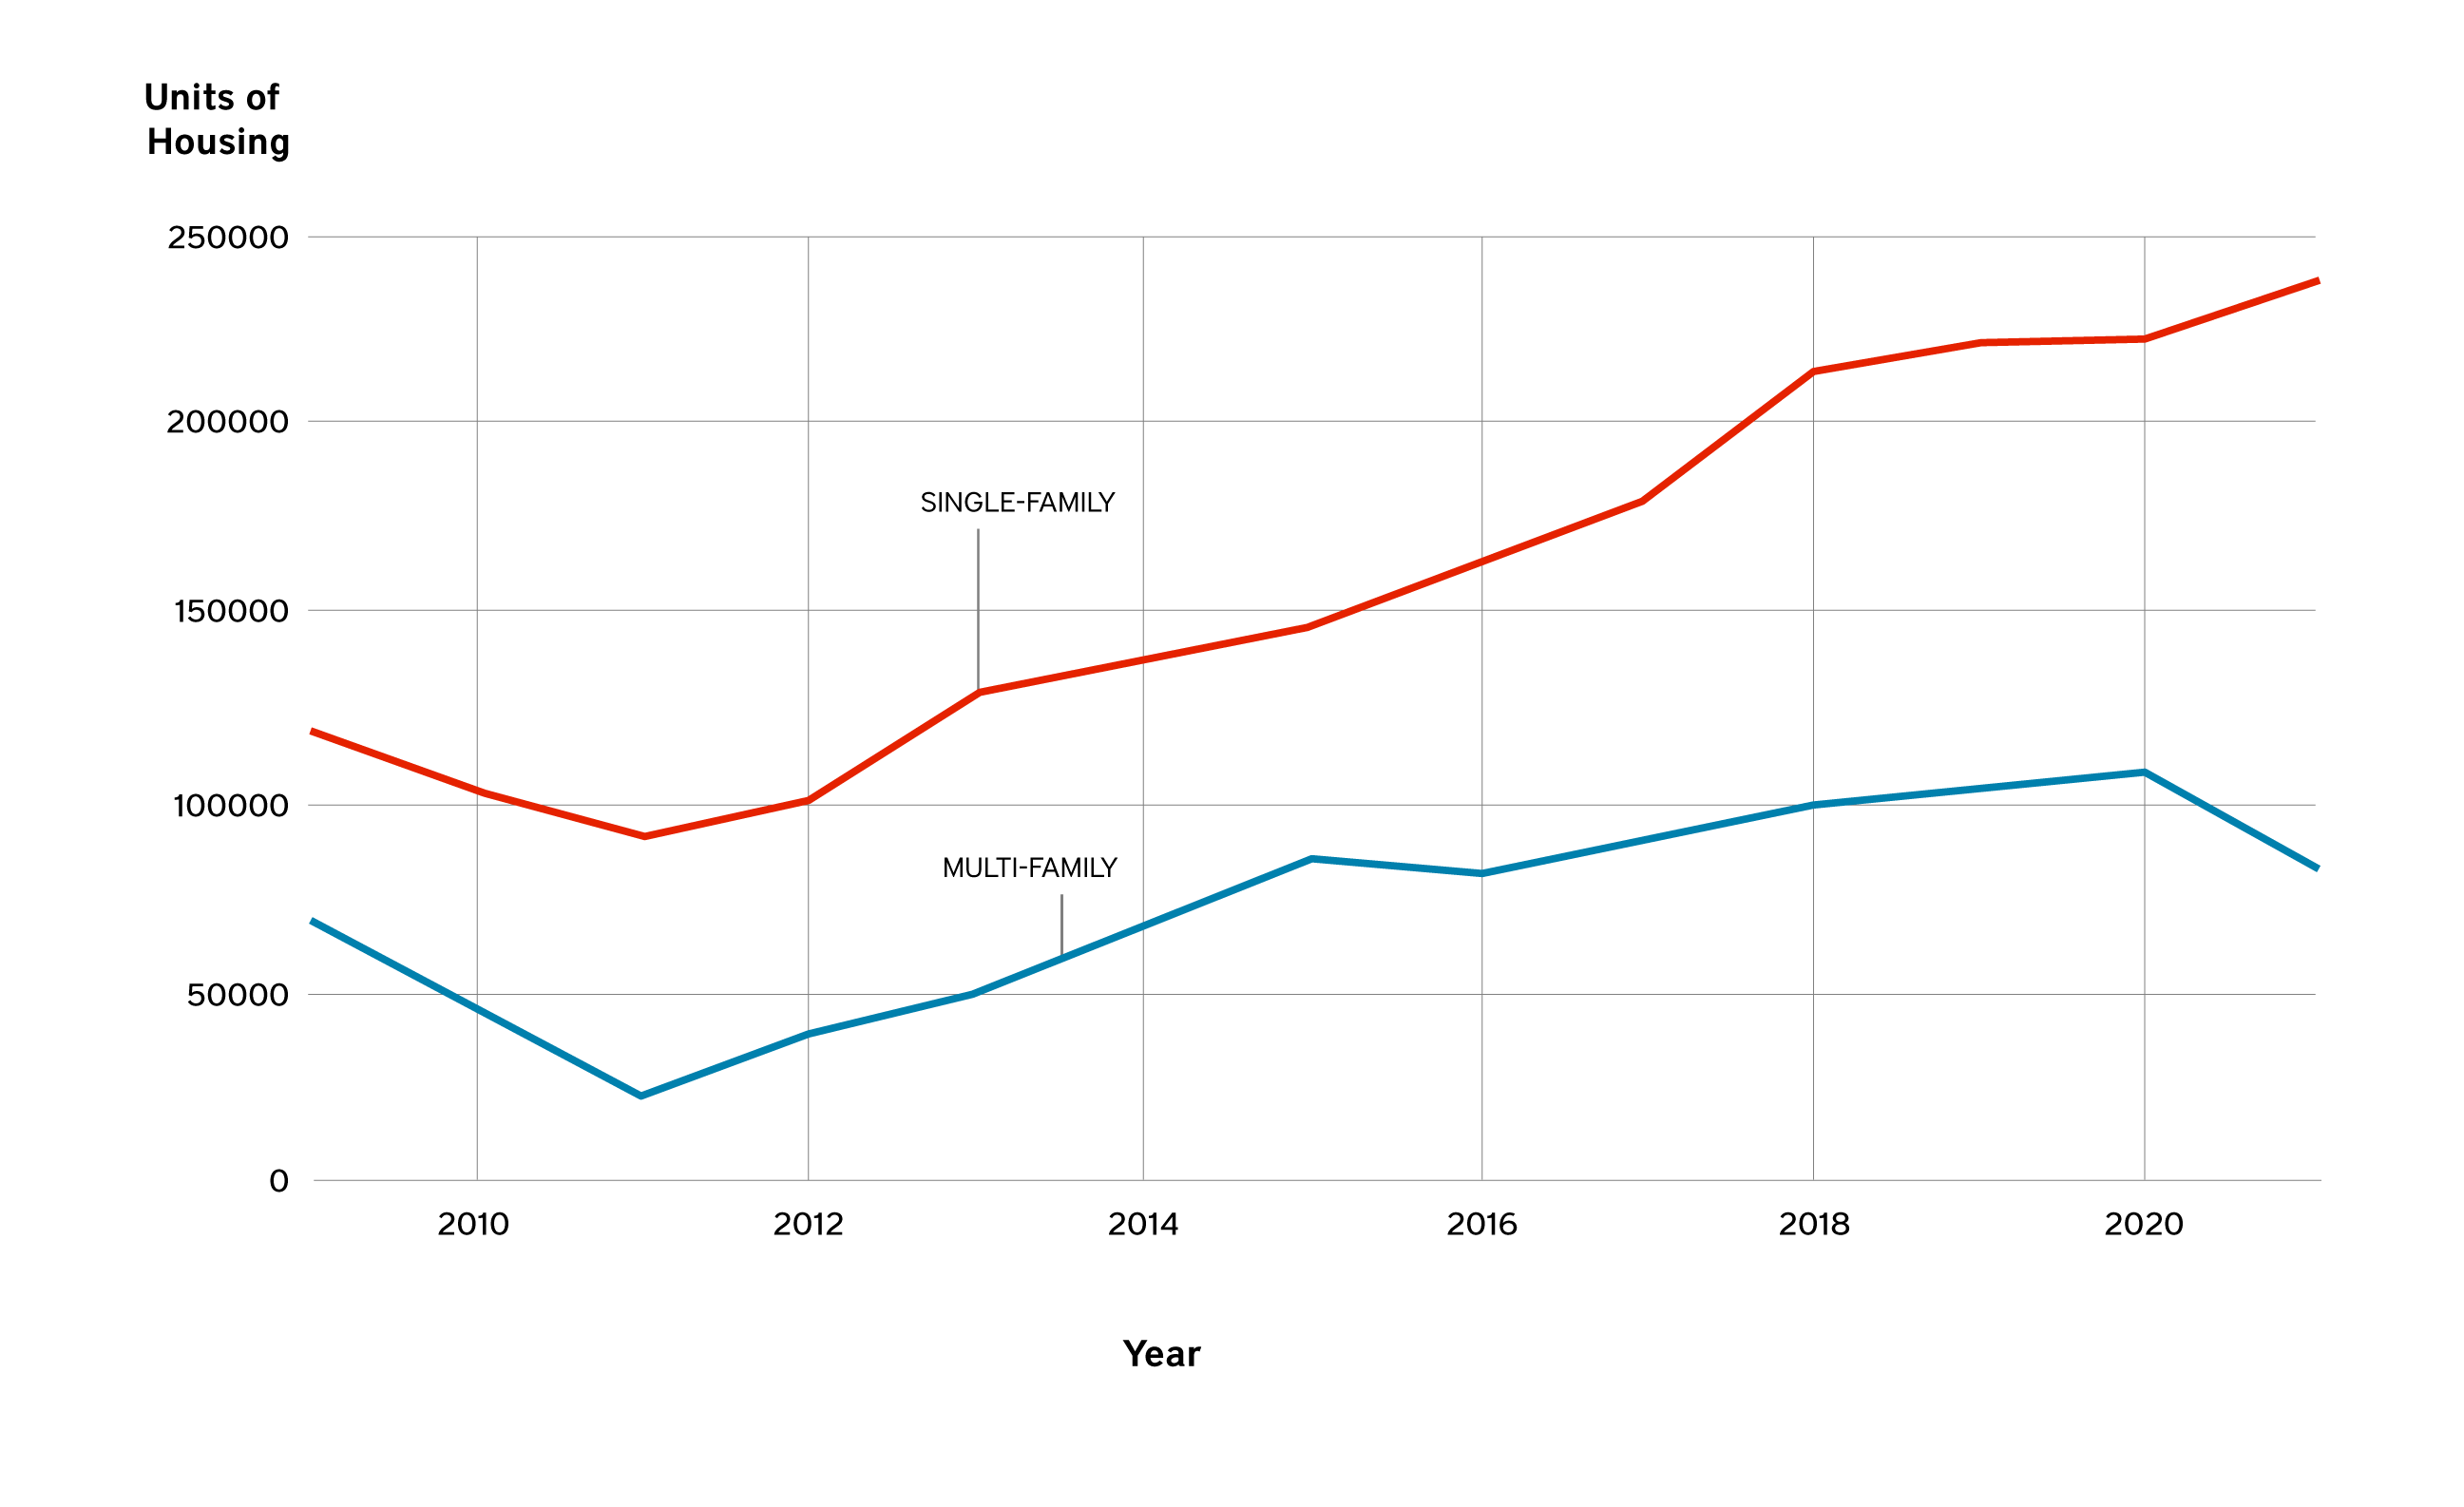
Despite the legislative progress toward increasing the housing stock and proportion of high-density housing in California, the construction of single-family homes far outpaces that of multifamily dwellings across the broader West. In fact, the number of newly constructed multifamily options, contrasting with the long-term trend, declined from 2020 to 2021, though single-family home construction continued to increase, as shown in the graph below. We will continue to monitor trends in new-home builds.
Completed Homes in the Western US by Year
Indicator 9: Change in Developed Land Use Classes 2001 – 2019
16.7% increase, 1,167 Square miles of land developed
Differing levels of development (categorized in the table below) have varying impacts on water resources, whether by increasing water demand or stormwater runoff. In 2001, total developed area within the CRBAAS was about 4,300 square miles, or just 1.7%. As of 2019, developed area had increased to about 2.2% of the CRBAAS, an area of 5,000 square miles—16.7% growth over just two decades. 7 The National Land Cover Database has four categories for the developed area shown in Developed Classifications and Descriptions within the National Land Cover Database, ranging from Developed, Open Space, with less than 20% impervious surface cover, to Developed, High Intensity, with 80–100 percent impervious surface cover. These are the data used to summarize net changes in development categories from 2001 to 2019.
Developed, High Intensity had the largest percentage increase, of 43.5%. This type of development tends to use water more efficiently, but it also increases impervious cover that can elevate stormwater runoff, flooding, and erosion while decreasing water quality and infiltration of rainwater that might promote groundwater recharge Definition(Pan, Deal, and Destouni 2018 Citation; McGrane 2016 Citation). High-intensity developed areas can also exacerbate urban heat-island effects, which can increase water use (Chow, Brennan, and Brazel 2012 Citation; Brazel et al. 2004 Citation) and worsen social vulnerability to extreme heat, particularly among marginalized groups. This increased urbanization affects water use in complex ways, and the impacts of densification vary from place to place.
The land use class with the second-largest increase was Developed, Medium Intensity, which increased by nearly 40% (2001–2019). This class, along with Developed, Low Intensity, contains most of the single-family-zoned properties, though some larger single-family (R1) properties can be found in the Developed, Open Space category. All developed land cover classes have increased, which aligns with the population growth described in the previous chapter. The developed-land-use classes are significant to water demand, while forested-land-use classes are more relevant to supply.
Indicator 10: Change in Forested Land Cover 2001 – 2019
Forest cover declined by 5.4%,
3,281 square miles of forest loss
Forest cover is an important indicator because, in the 11 western states, 65% of surface water supply originates on forested lands, even though forest covers only 29% of the land area (Brown, Hobbins, and Ramirez 2005 Citation). Forested watersheds provide a myriad of beneficial hydrologic services Definition, including moderating snowmelt, intercepting precipitation, and lowering the magnitude of peak streamflows (McCorkindale 2016 Citation; Bladon et al. 2014 Citation; Brauman et al. 2007 Citation).
Reduced forest cover was the largest single land use change in the CRBAAS between 2001 and 2019. The National Land Cover Database has three forest land-cover classifications: Deciduous Forest, Evergreen Forest, and Mixed Forest. All three classes declined, with the largest drop (6.4%) in Evergreen Forest. Across all three classes, forest cover declined by 5.4%.8
The loss in forest cover across the Basin states can be tied to several factors. Wildfires, insect outbreaks, disease, drought, and human activity—including encroaching development—are the leading causes of tree mortality (Berner et al. 2017 Citation). Since 1990, one in three new homes in the U.S. was built in the wildland-urban interface (WUI) Definition, or on lands adjacent to or in forests or shrublands, with states in the Colorado River Basin having some of the country’s highest rates of WUI development (Radeloff et al. 2018 Citation). Increasing aridity has made trees more susceptible to disturbances such as bark beetle outbreaks and wildfires.
Wildfire, particularly, is beginning to change land cover. In the past decade, climate change has tripled the frequency and quadrupled the size of wildfires (Iglesias, Balch, and Travis 2022 Citation). While most western US forests are well adapted to wildfire, warming temperatures and more frequent drought are challenging forests’ ability to recover after severe wildfires (Davis et al. 2019 Citation; Rodman et al. 2020 Citation; Stevens-Rumann et al. 2018 Citation). The combined effects of severe fires and poor post-fire recovery can lead to a “type conversion,” meaning forested areas convert to other land cover types. (Guiterman et al. 2022 Citation; Savage et al. 2013 Citation). Such changes can alter how much water seeps into the ground and into underground aquifers—a process known as groundwater recharge—and may alter or eliminate the hydrologic services once provided by forested watersheds.
Aside from land cover change, severe wildfires can significantly threaten water quality and quantity, making water supplies volatile after fire events (Williams et al. 2022 Citation). By reducing vegetation cover and altering soil-water repellency, wildfires increase flood risk and erosion, which in turn can introduce ash, sediment, and nutrients into reservoirs and water supplies as well as damage property and water infrastructure (Smith et al. 2011 Citation). The 2022 Calf Canyon/Hermits Peak Fire in northern New Mexico burned an area larger than Los Angeles. When the monsoonal rains arrived, ash and contaminants were washed into the city’s water supply and contaminated local wells.9 Two wildfires that burned in the San Francisco Peaks near Flagstaff in the summer of 2022 led to over 40 major flood events,150 flash flood warnings, and over $1 billion of damage.10
The way forested land cover changes in the decades to come—due to climate change, development, and forest management—will clearly have outsized impacts on water quality and quantity in the Colorado River Basin.
Summary of Development and Land Use Patterns
This chapter presented several indicators, including development patterns and forest loss in the Basin. These indicators monitor aspects of land use that will have significant implications for the water future of the CRBAAS.
Current zoning laws favor single-family zoning, and the construction of single-family homes still outpaces that of denser multifamily homes, though this might be slowly changing. The 2021 infrastructure bill would award grants and tax credits to cities that change zoning laws by incentivizing denser development and smaller lot sizes.11 As mentioned before, California has passed legislation to increase the housing stock and the density of development. New-construction trends show that lot sizes are shrinking across the West, which already has the smallest lot sizes. On average, smaller lots consume less water per capita. In subsequent reports, we will explore the adoption of conservation-oriented landscape ordinances and their effectiveness at reducing per capita water use. Conservation-oriented landscaping ordinances that were successfully adopted—in Aurora and Westminster, Colorado—are highlighted in Integrating Water Efficiency Into Land Use Planning in the Interior West: A Guidebook for Local Planners, published by Western Resource Advocates and the Land Use Law Center.
Development often goes hand in hand with land use changes, and forests represent one of the most significant water-related land uses. Healthy forests and watersheds provide a plethora of hydrologic ecosystem services, which are critical for maintaining future water supplies (McCorkindale 2016 Citation; Bladon et al. 2014 Citation; Brauman et al. 2007 Citation). Greater wildfire risk poses serious threats to western forests and water supplies, and presents a myriad of challenges to water quality, quantity, and timing of streamflow (Goeking and Tarboton 2020 Citation; Williams et al. 2022 Citation).
The Babbitt Center will continue to monitor changes in developed areas across the CRBAAS and plans to incorporate indicators on outdoor municipal water use and urban heat in communities in the CRBAAS in subsequent reports. We plan to expand our indicators to cover wildfire and water supply in more depth as this project continues.